💎Zillioner Club: 2026 Q1 Market Outlook

DISCLAIMER — Zillioner Club Market Outlook: This informational report by Zillioner Club is not a financial recommendation. Trading Equities, Forex, and Digital Assets involves high risk; past performance doesn't guarantee future results, and leverage can exceed initial deposits. While based on reliable data at the time of publication, we do not warrant accuracy or accept liability for losses. Zillioner Club may hold contrary positions. Users must conduct independent research and consult professionals. By accessing this content, you release Zillioner Club from responsibility for any resulting financial actions.
I. 🗺️ Strategic Macro Analysis (1–3 Year Outlook)
This section establishes the foundational economic environment for the next 1–3 years, justifying the long-term structural asset allocation.
1. Understanding the Macro Cycle Mechanics
The Global Macro Cycle represents the rhythmic fluctuation of economic activity driven by the interplay between productivity, credit cycles, and monetary policy. We view these cycles through four distinct quadrants, defined by the rate of change (first derivative) of Growth (G) and Inflation (I).
The Four Quadrants
- Recovery (G↑, I↓): Early stage where central banks ease, leading to a rebound in manufacturing and sentiment.
- Expansion (G↑, I↑): The "Goldilocks" phase where growth is robust and inflation begins to normalize.
- Late-Cycle Slowdown (G↓, I↑): Growth starts to decelerate while inflation remains sticky or "peaky." Credit becomes restrictive.
Contraction (G↓, I↓): Recessionary environment where both growth and inflation collapse, forcing a defensive pivot.
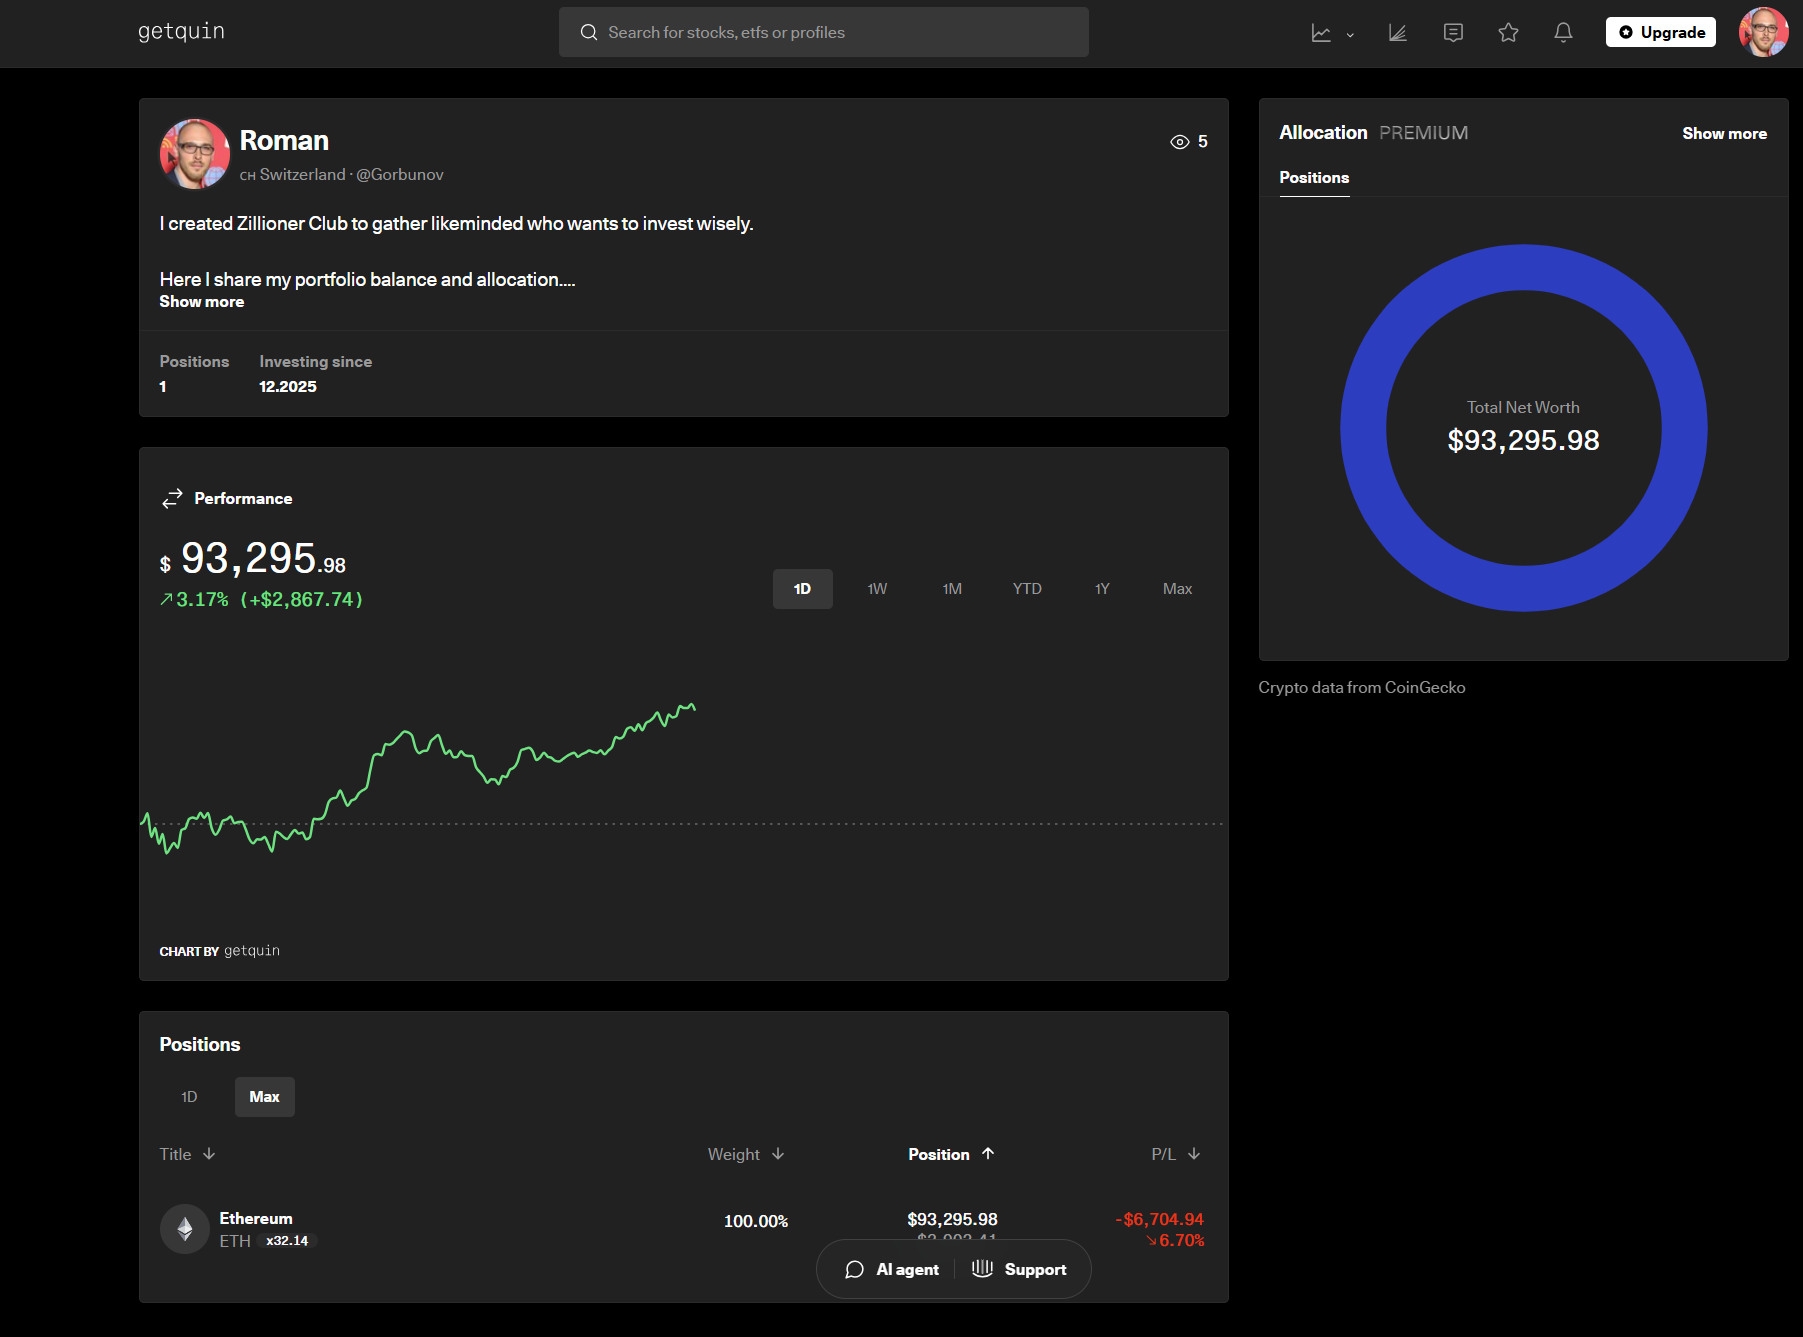
Live Balance Access: I provide a real-time window into my personal portfolio. You see exactly what percentage of my portfolio is in Gold, BTC, or Equities at any given moment.
My "Load & Offload" Log: When I decide to load a position or offload to cash, I share it the subscribers immediately.
Zero-Homework Conviction: I spend my days deconstructing the noise so I can make high-conviction moves. Each of my research is thousands of hours processing market data through a prism of professional knowledge and modern technology to distill noise from a signal.
The Philosophy: I have skin in the game. I’m simply opening the door so you can see exactly how I navigate the market. 🛳
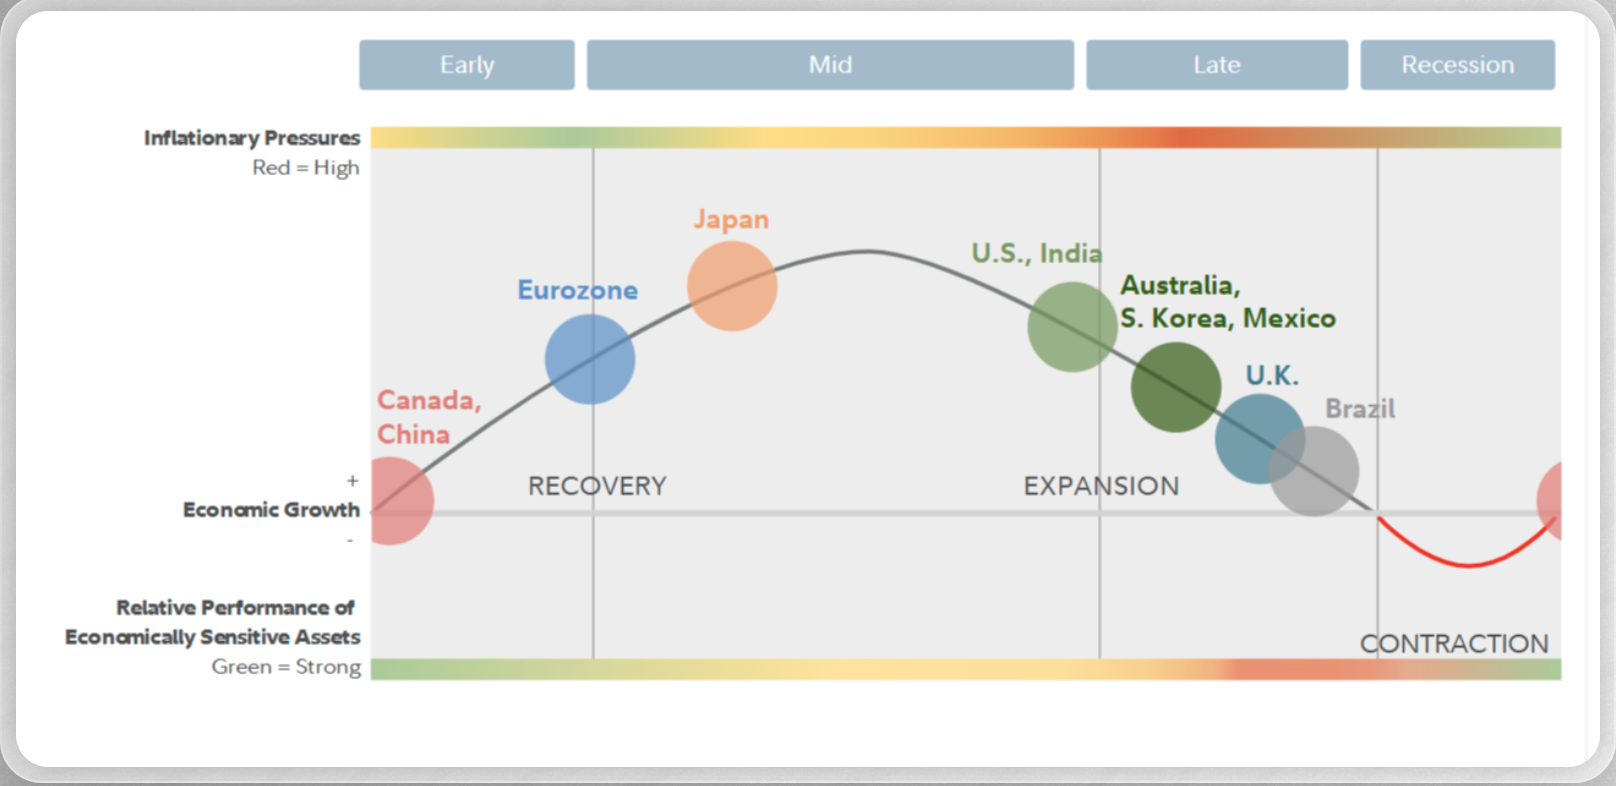
1.1. Current Phase: "Late-Cycle Slowdown / Soft Landing"
A significant cluster of systemically important economies, led by the United States, is currently traversing the Late-Cycle Slowdown. This specific phase identification relates to the dominant group of nations positioned on the downward slope of the expansion curve, including India, Australia, South Korea, Mexico, and the United Kingdom. These "U.S.-led" economies represent the primary engine of global demand and financial liquidity; their synchronized movement into the late cycle is driven by similar monetary tightening paths and high sensitivity to the USD-denominated credit cycle.
Conversely, the global landscape is becoming increasingly fragmented as we approach Q1 2026. The Eurozone is currently transitioning from its early recovery into a Mid-Cycle expansion, benefiting from easing energy costs and a stabilization in manufacturing. Furthermore, several emerging markets are entering a renewed growth phase independently of the U.S. trajectory, as local inflation cools faster than in the West. This divergence creates a complex environment where "Late-Cycle" economies face the risk of a "Hard Landing" if monetary policy remains tight, while the Eurozone and "Early-Cycle" nations (like China and Canada) provide a potential floor for global demand through manufacturing rebounds and localized credit easing.
Arguments for U.S.-Led Economic Dominance
The economies identified as "led by the United States" (India, Australia, South Korea, Mexico, UK) share specific structural ties that bond their cycles to the U.S. trajectory:
- Trade Integration & Supply Chains: Countries like Mexico and South Korea are deeply integrated into the U.S. consumer engine. A slowdown in U.S. demand directly impacts their industrial output, effectively forcing them into the same macro quadrant as their primary export partner.
- Monetary Policy Correlation: Due to the "Interest Rate Anchor" (detailed below), central banks in Australia, the UK, and India often mirror Federal Reserve movements to prevent massive capital outflows and currency depreciation, aligning their domestic credit cycles with U.S. financial conditions.
- Geopolitical & Financial Alliances: These nations represent the core of the Western-aligned financial system. Their shared reliance on USD-based clearing and cross-border investment flows means that a liquidity tightening in New York is felt instantly in London, Seoul, and Mumbai.
The Hegemony of the U.S. Economic Influence
Despite the rise of multi-polarity and the "Early-Cycle" rebound in the Eurozone and China, the U.S. economy continues to exert a disproportionate and major influence on global markets for three critical reasons:
- The Interest Rate "Anchor": As the provider of the global reserve currency, the U.S. Federal Reserve effectively sets the "risk-free rate" for the world. When the U.S. is in a Late-Cycle phase with high real rates, it forces other central banks to maintain higher-than-desired rates to protect their currencies, regardless of their local macro phase.
- The USD Funding Gap: Most global trade and corporate debt are denominated in USD. A U.S. slowdown typically leads to a "strong dollar" safe-haven flight, which effectively tightens financial conditions globally by making debt servicing more expensive for Emerging Markets. The U.S. Dollar remains the foremost global reserve currency, used in over 80% of foreign exchange transactions and more than half of global trade. Even with gradual "de-dollarization" efforts in some regions, the dollar's resilience continues to attract global capital due to higher relative interest rates compared to Europe and Japan.
- Sentiment & Wealth Effect: U.S. equity markets represent nearly 60% of global market capitalization. A tactical downturn in the S&P 500 during a Late-Cycle transition triggers a global "risk-off" sentiment that overrides local fundamental improvements in the Eurozone or Asia.
1.2. U.S. Business Cycle: Transition Analysis (2025–2026)
The U.S. business cycle serves as the primary benchmark for global risk appetite. As we transition through 2025 into early 2026, the trajectory has defied traditional recessionary expectations. Rather than a linear decline into contraction, the economy has exhibited a "rolling stabilization" pattern. However, this unique path—suggesting a mid-cycle reset within a broader late-cycle framework—raises significant questions about the underlying mechanics of the reversal.
Analysis of the Phase Trajectory (Q1 2026 vs. Q3 2025)
Our internal modeling and visual cycle tracking reveal a significant non-linear progression that warrants deeper scrutiny:
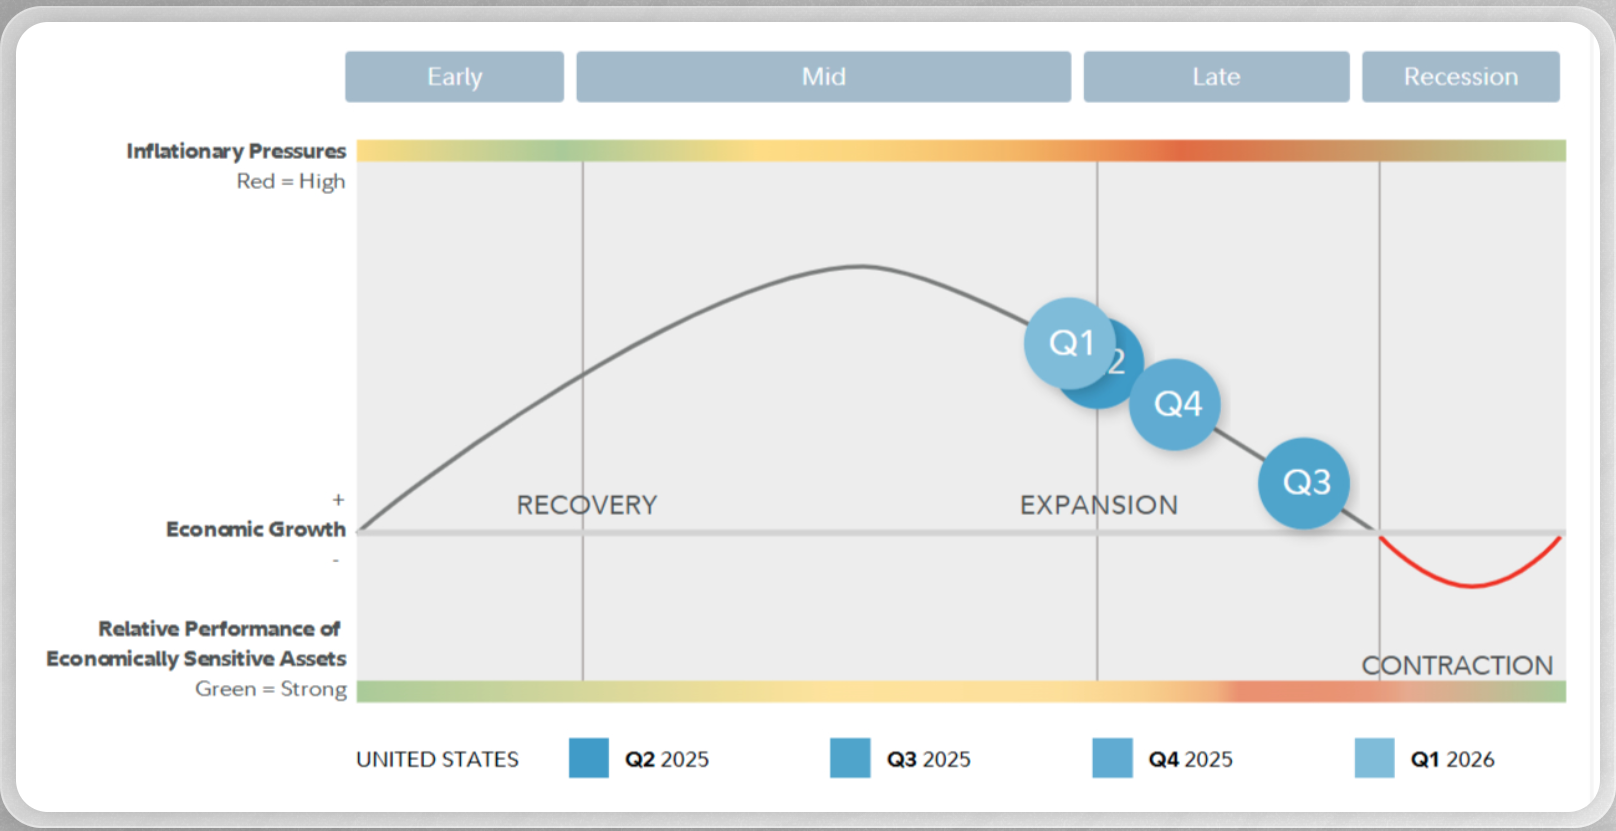
Q3 2025 (The Late-Cycle Extremity): During this quarter, the U.S. reached the furthest extremity of the Late-Cycle phase. Plotted at the precipice of the Contraction boundary, this period represented the peak "lag effect" of high interest rates. Growth (G) appeared to be decelerating toward zero while core inflation remained "sticky."
Q1 2026 (The Anomalous Reversal): In a departure from historical norms, Q1 2026 is currently plotted earlier on the cycle curve, situated at the intersection of Mid-Cycle expansion and Late-Cycle slowdown. This "backward" move on the curve indicates a re-acceleration of the growth impulse. It signifies that the economy avoided the Q3 2025 shock and pivoted, but the fundamental drivers of this transition require careful deconstruction.
Drill-Down: Macro Conditions Driving the Reversal
To understand the "real effect" of this cycle reversal, we analyze the specific metrics that provided the 2026 Q1 floor:
- Financial Conditions (FC): Conditions have eased significantly following the start of rate cuts in late 2025, acting as the primary engine for the "Soft Landing." However, this trajectory is complicated by high fiscal deficits (where government spending persistently exceeds revenue), which stimulate short-term demand but increase long-term debt servicing costs. Furthermore, the 2026 U.S. election cycle introduces political uncertainty that could rapidly tighten these conditions.
- Growth (G) Resilience: U.S. GDP is projected to moderate toward a trend of 1.6%–1.8% in 2026 Q1. The AI-driven capex boom appears to be the primary defensive wall, providing enough private investment to offset cooling labor markets and softer consumer sentiment, even as global growth remains tepid (2.5%–3.2%).
- The Real Rate (R) Trajectory: With the Fed easing (projected Fed Funds Rate of 3.00%–3.25% by end of 2026), nominal rates are falling. However, because inflation remains "sticky," Real Rates (R) are compressing, effectively lowering the real cost of capital. This dynamic is a primary catalyst for the resilience in risk assets and Gold.
- Projected Real Rate Adjustment: The next projected 25 bps cut in Q2 2026 is expected to compress the Real Rate further toward 0.5%–0.75%, deepening the negative correlation with the USD.
- Inflation (I) - The "Last Mile" Problem: Headline PCE (total inflation including volatile items like food and energy) and Core PCE (inflation excluding food and energy) are expected to remain above target (Core PCE ~2.8%-3.1% in 2026 Q1). This illustrates the "Last Mile" problem: the economic difficulty of pushing inflation from a stubborn 3% down to the 2% target without triggering a recession. Current data suggests tariff effects and labor tightness are effectively setting a 3% floor, preventing a full return to the "Recovery" phase (low inflation).
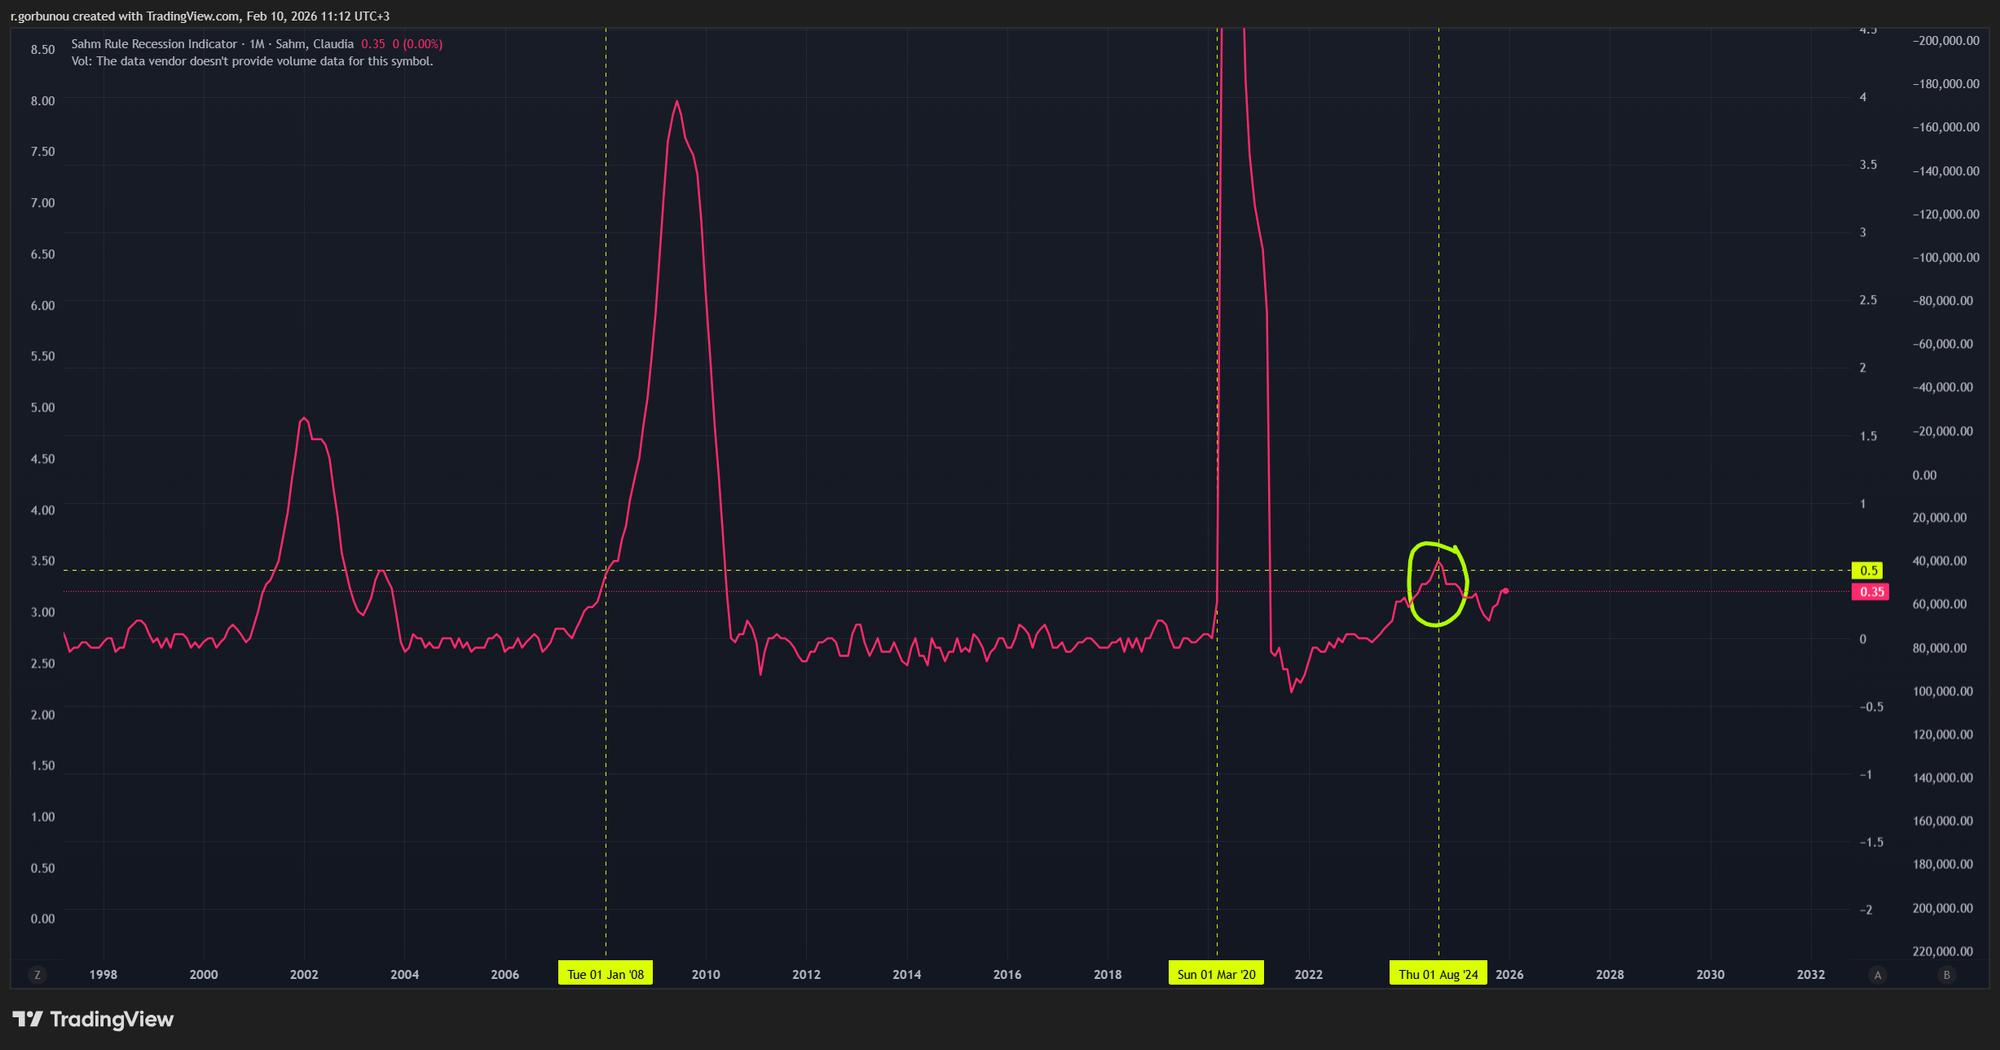
- The Labor Dynamic: Structural Fragility vs. Statistical Noise: The retreat of the Sahm Rule from 0.53 in July 2024 to 0.35 in February 2026 is often cited as a definitive "Soft Landing" signal. However, a deeper analysis reveals that the labor market is not fundamentally strengthening, but rather undergoing a structural dilution that makes traditional indicators less reliable:
- Productivity Paradox: While the AI boom has kept private investment high, we have yet to see this translate into broad-based labor productivity. The labor market is effectively "hanging by a thread" where the quantity of jobs is high, but the quality and structural stability are at cycle-lows.
- Labor Hoarding as a Floor: Companies have maintained headcounts despite higher rates not out of growth, but to avoid the high cost of re-hiring in a specialized market. This "hoarding" has created an artificial floor for the unemployment rate, preventing the Sahm Rule from accelerating.
- The "Side Hustle" Mirage: Official statistics currently fail to distinguish between high-productivity employment and the explosion of the "gig economy." With multiple jobholdings reaching record levels, the labor market is being held up by a "survival buffer" where individuals take second or third jobs to keep up with persistent inflation. This masks the underlying cooling of primary employment sectors.
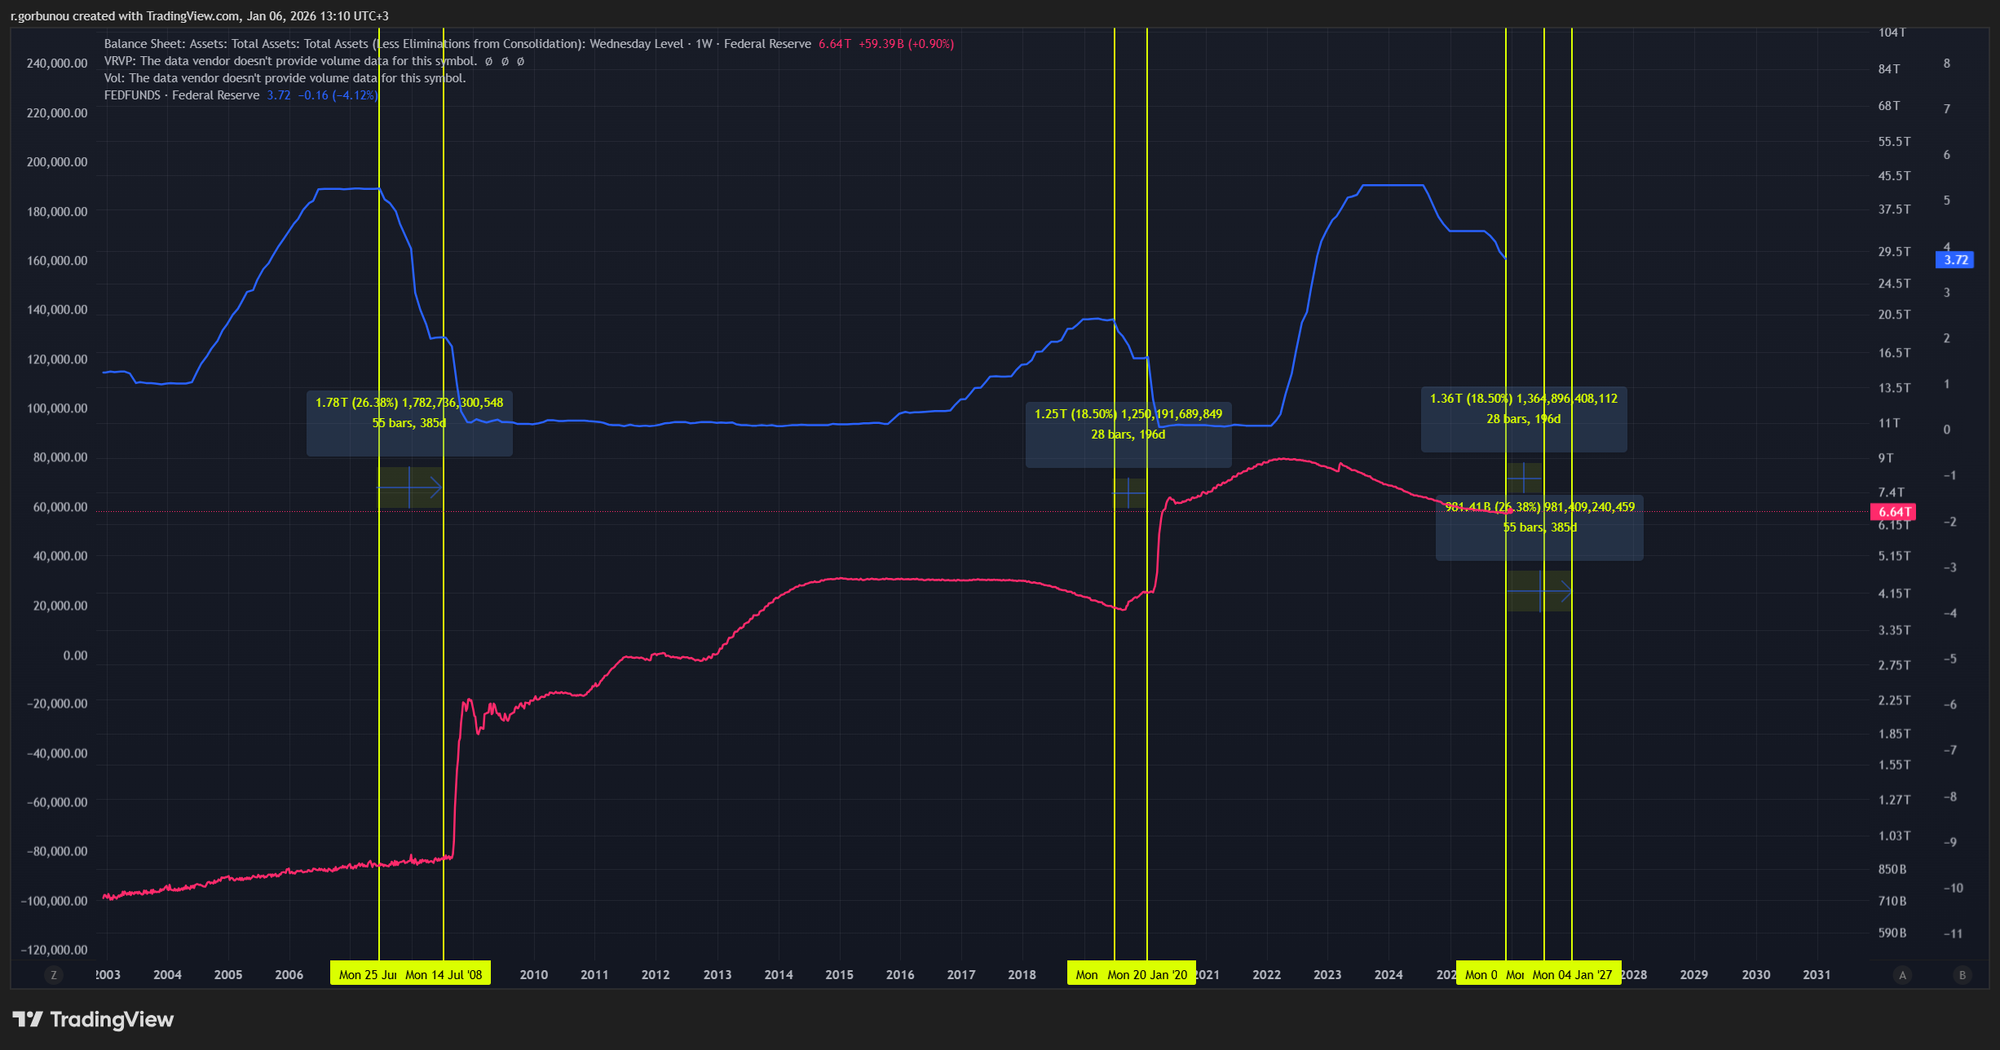
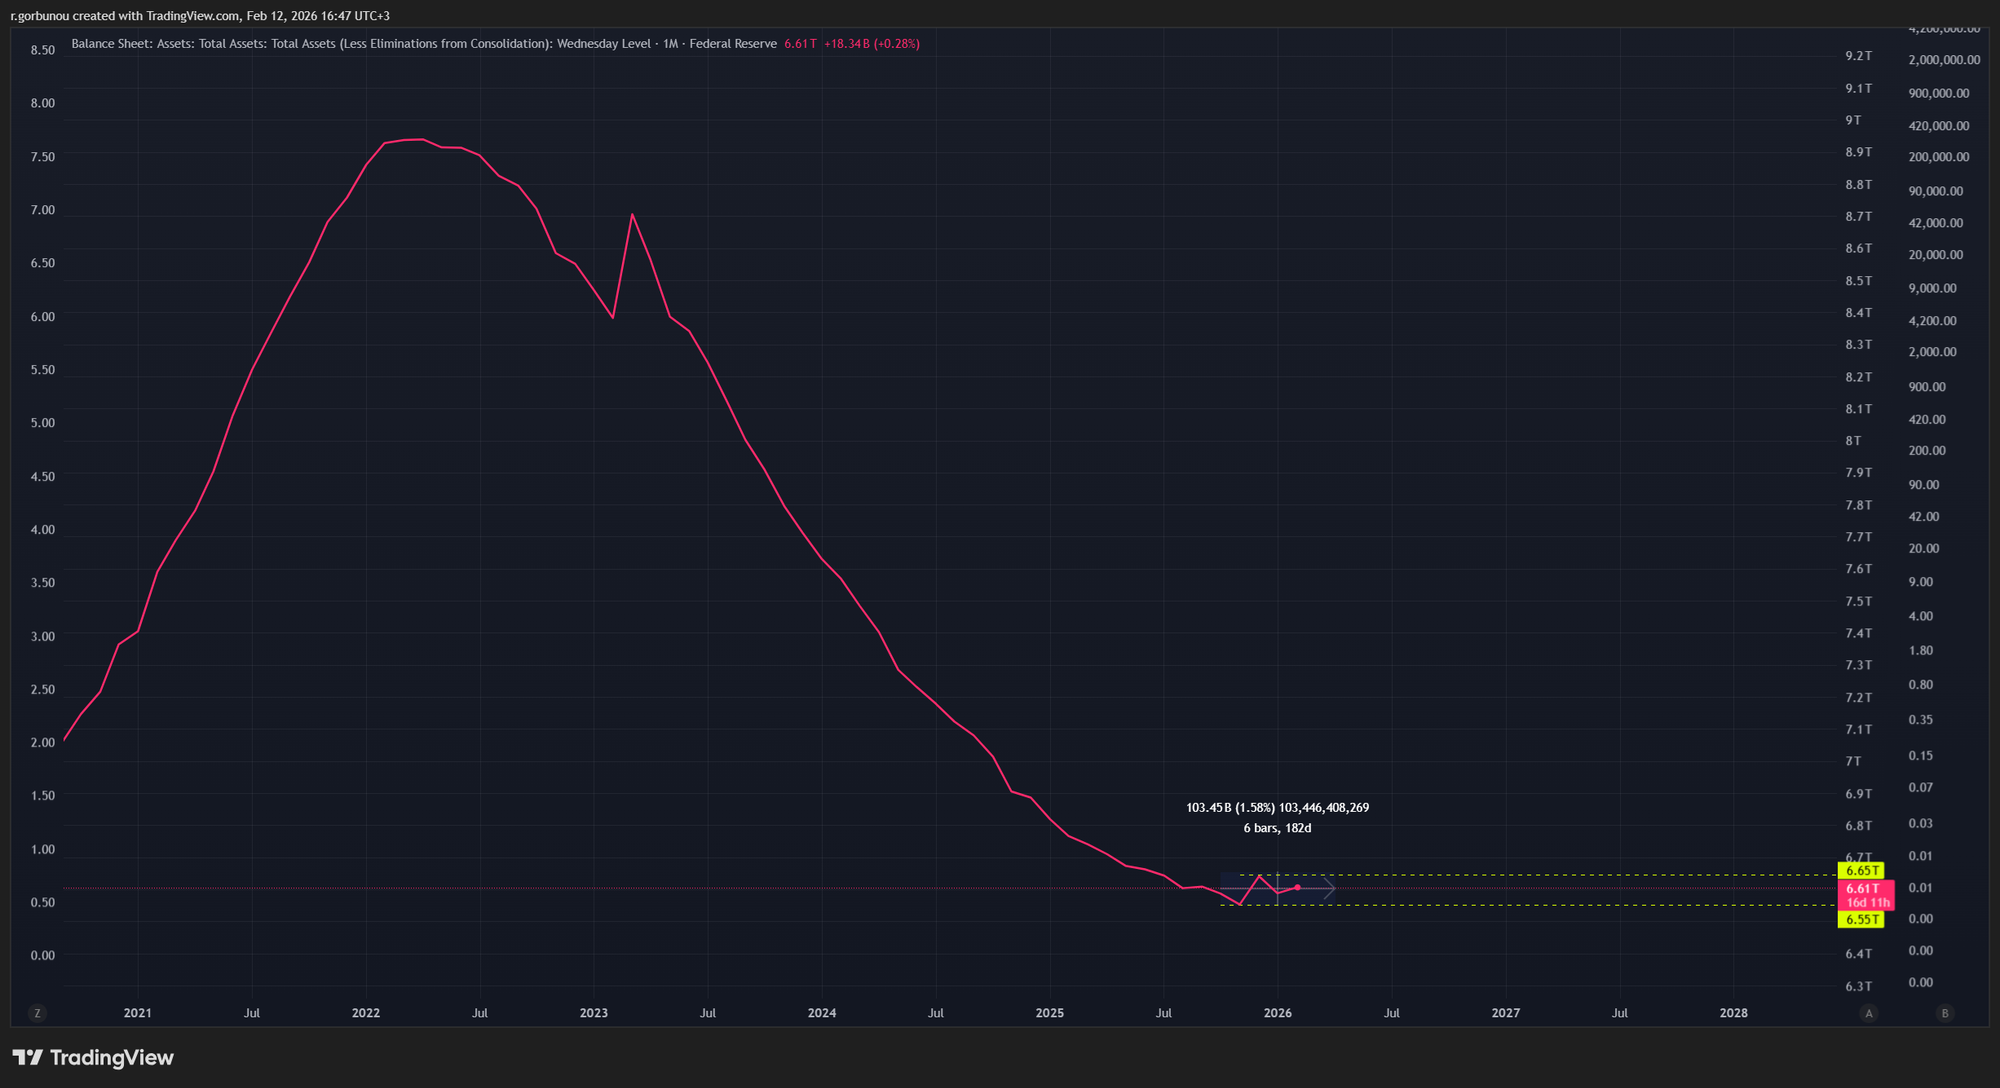
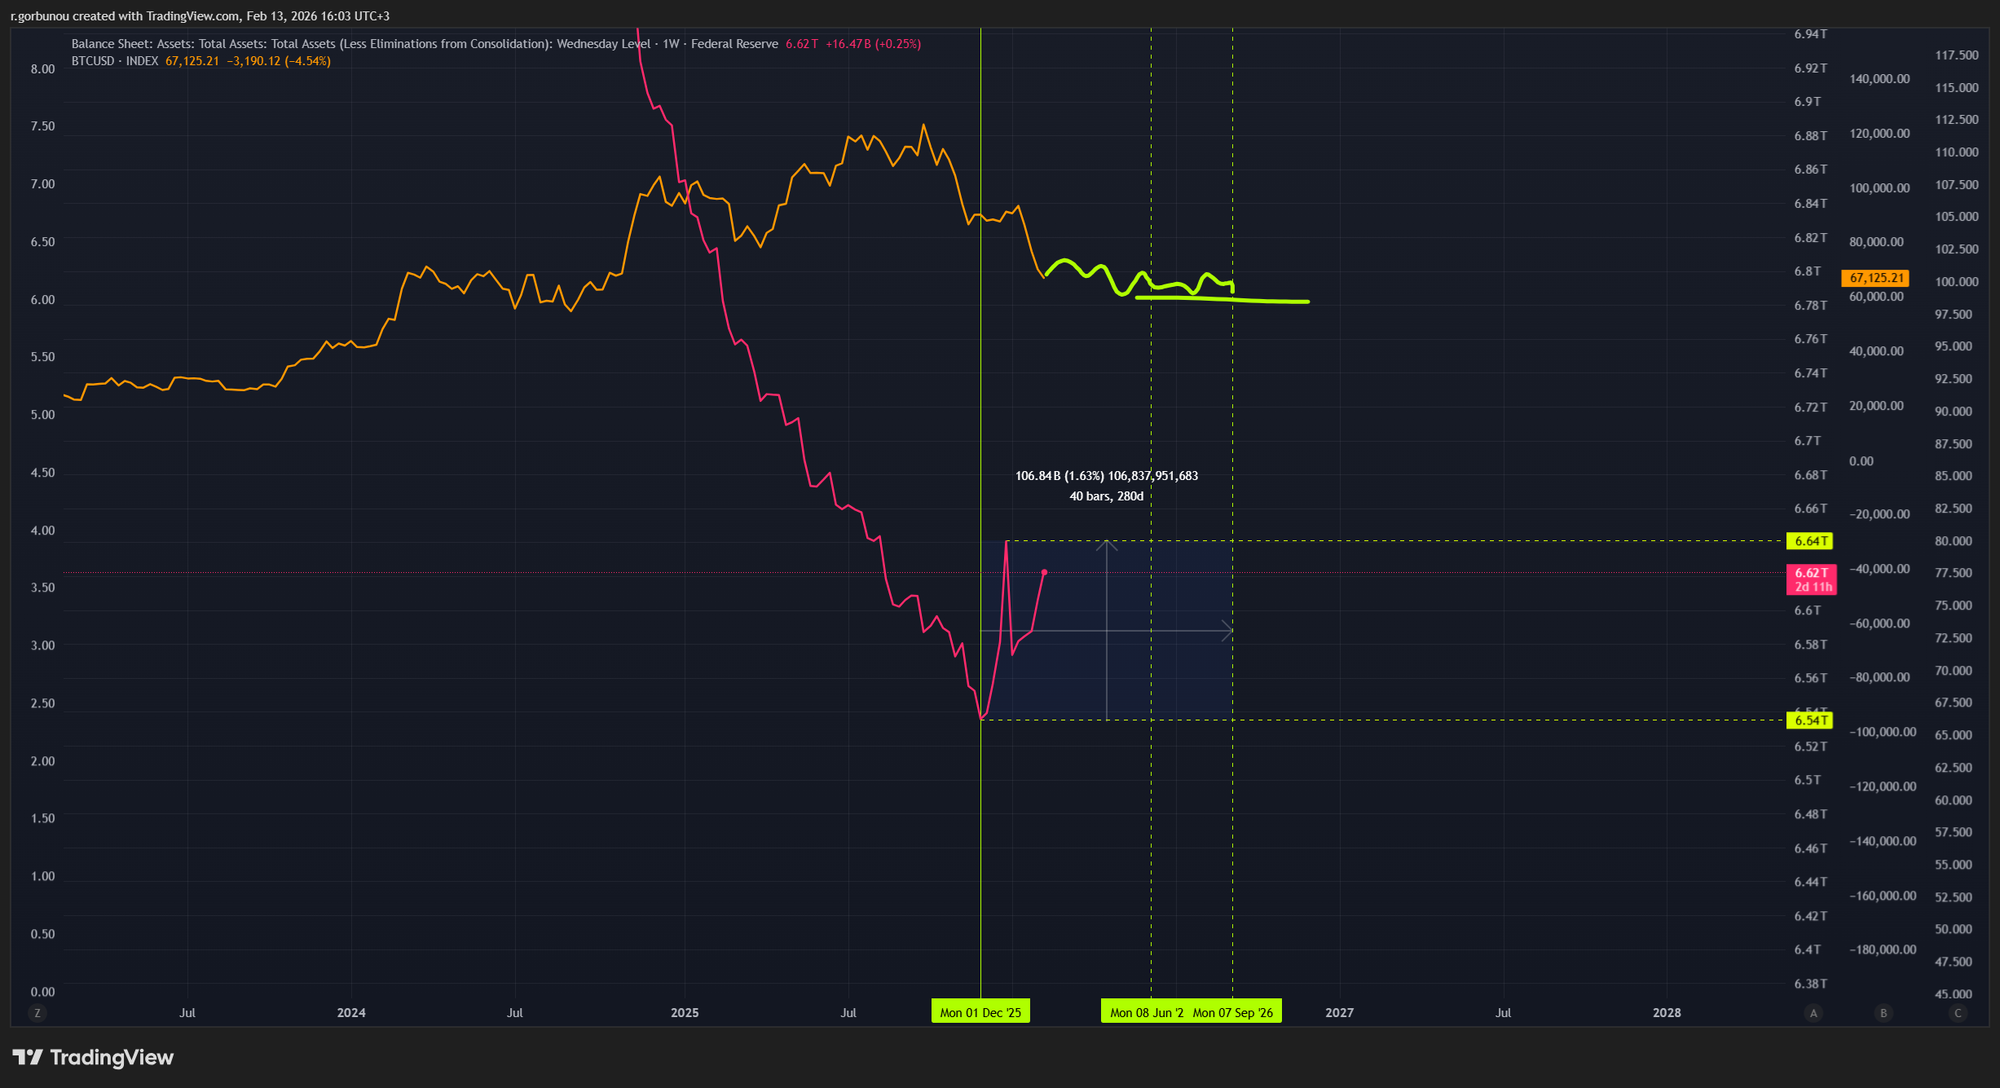
- Fed Balance Sheet (WALCL) & Liquidity Anchor: Analysis of the Total Assets (WALCL) chart shows a stabilization around $6.64T after a long period of contraction. This halt in Quantitative Tightening, combined with a falling Federal Funds Rate (currently 3.72%), acted as a "liquidity bridge." By stopping the drain of reserves while simultaneously cutting rates, the Fed provided the necessary financial plumbing to support asset prices and prevent a credit freeze during the transition from Q3 2025 to Q1 2026.
- U.S. Financial Market Analysis: The S&P 500 (currently trading at 6,941) exhibits the classic structure of a "Blow-Off Top," driven to record highs near 7,000 by the speculative "AI Capex" narrative and the Federal Reserve's "Liquidity Bridge" (cessation of QT). This vertical rally has created a fragile technical divergence where price has decoupled from long-term moving averages.
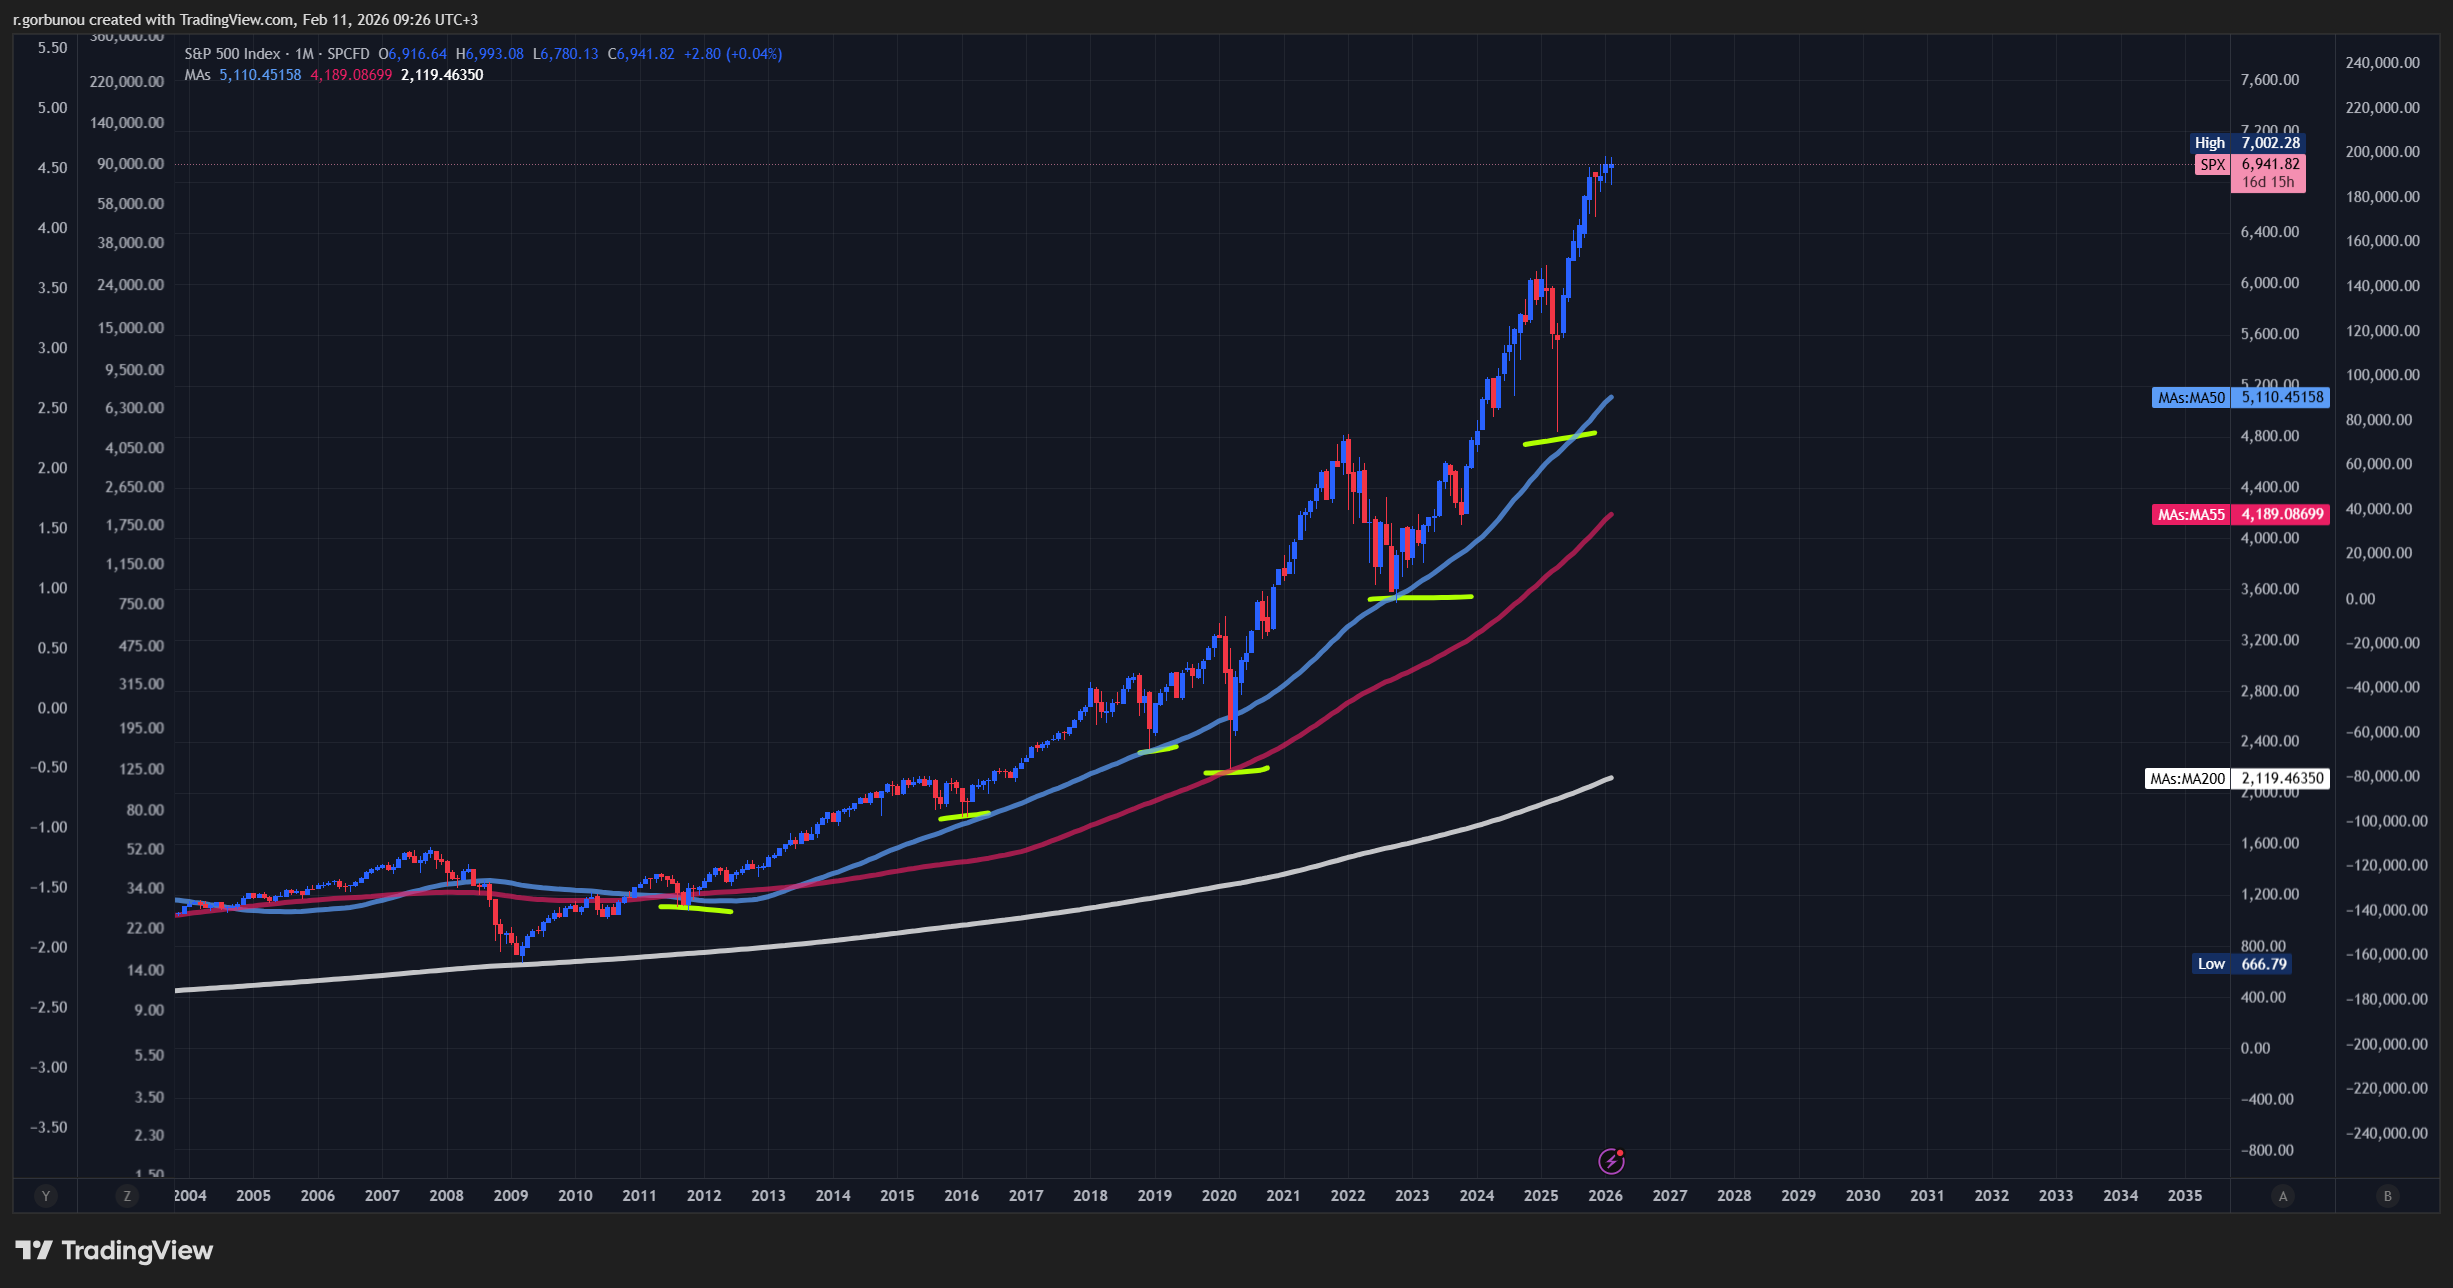
- Technical Risk: A critical "Air Pocket" exists between current levels and the structural support at 5,745. A technical failure to hold the immediate support zone (~6,800) would likely trigger a rapid valuation reset to fill this void.
- Historical Context: The index has sustained an average growth rate of ~13% over the last 2-3 years, a statistical anomaly that signals an overdue "cool-down" period. The market is currently "Priced for Perfection," meaning valuations have eliminated the margin of safety, making the index hypersensitive to even minor economic data misses.
Resolution: Market Risks & Portfolio Impact (Q1–Q2 2026)
While the "backward" move on the cycle curve is positive for short-term sentiment, we must account for three primary risks when allocating assets:
- S&P 500 Concentration & Valuation Risk: The index's resilience is entirely dependent on the AI-driven capex boom, which drove a speculative "Blow-Off Top." With the index trading at 6,941 and a massive "Air Pocket" down to structural support at 5,745, a technical failure at 6,800 could trigger a rapid valuation reset.
- The "Self-Fulfilling" Risk: This prolonged bull market has created a fragile feedback loop. A technical correction wouldn't just reflect economic weakness; it could induce a real-world recession by evaporating the "paper wealth" that currently sustains consumer confidence and spending. The market's sustained growth has effectively become a risk in itself.
- The USD Reversal: If the Eurozone's Mid-Cycle expansion gains momentum while the U.S. remains stuck in "Late-Cycle Slowdown," we expect a sharp weakening of the USD. This would provide a massive tailwind for Gold and Bitcoin, but could create inflationary pressure in the U.S. via higher import costs, complicating the Fed's "Soft Landing" path.
- Crypto Market Volatility (The Liquidity Lag): Bitcoin and Ethereum are hypersensitive to Global M2 liquidity and Financial Conditions (FC). While the Fed has provided a "liquidity bridge," the "Last Mile" inflation problem means rates may stay higher-for-longer than crypto bulls anticipate. Crypto is particularly at risk if the "diluted labor" market snaps; a sudden spike in unemployment would likely trigger a "dash for cash" where highly leveraged crypto positions are liquidated first.
II. 🌐 The Crypto Market Architecture: The Great Dispersion
This section represents our primary analytical pillar, focusing on the structural evolution of digital assets as they transition from speculative peripheral assets to the core of the global financial system. Our focus here is to define the boundaries of the current bear cycle and identify the mechanical triggers for the next regime shift.

Subscribe to the Zillioner Club YouTube: If you’re more of a visual person, head over to the channel where I flip the script and turn my research into video. It’s the same deep-dive market reviews, but I’m walking you through the charts and the "why" behind my views in real-time. I use the video format to cut through the noise, showing you exactly what I'm seeing in the data so you can catch the vibe of my strategy much faster than reading a wall of text. Hit subscribe to get these video briefings and see how I’m reading the tape.
2.1 Bitcoin vs. S&P 500: The Correlation Breakdown
Historically, Bitcoin and the S&P 500 have exhibited high convergence. From Bitcoin's inception in 2009 through 2024, both assets were largely driven by the same "cheap money" liquidity cycles. However, 2026 has introduced a structural decoupling, signaling a regime shift in how digital assets interact with traditional equities.
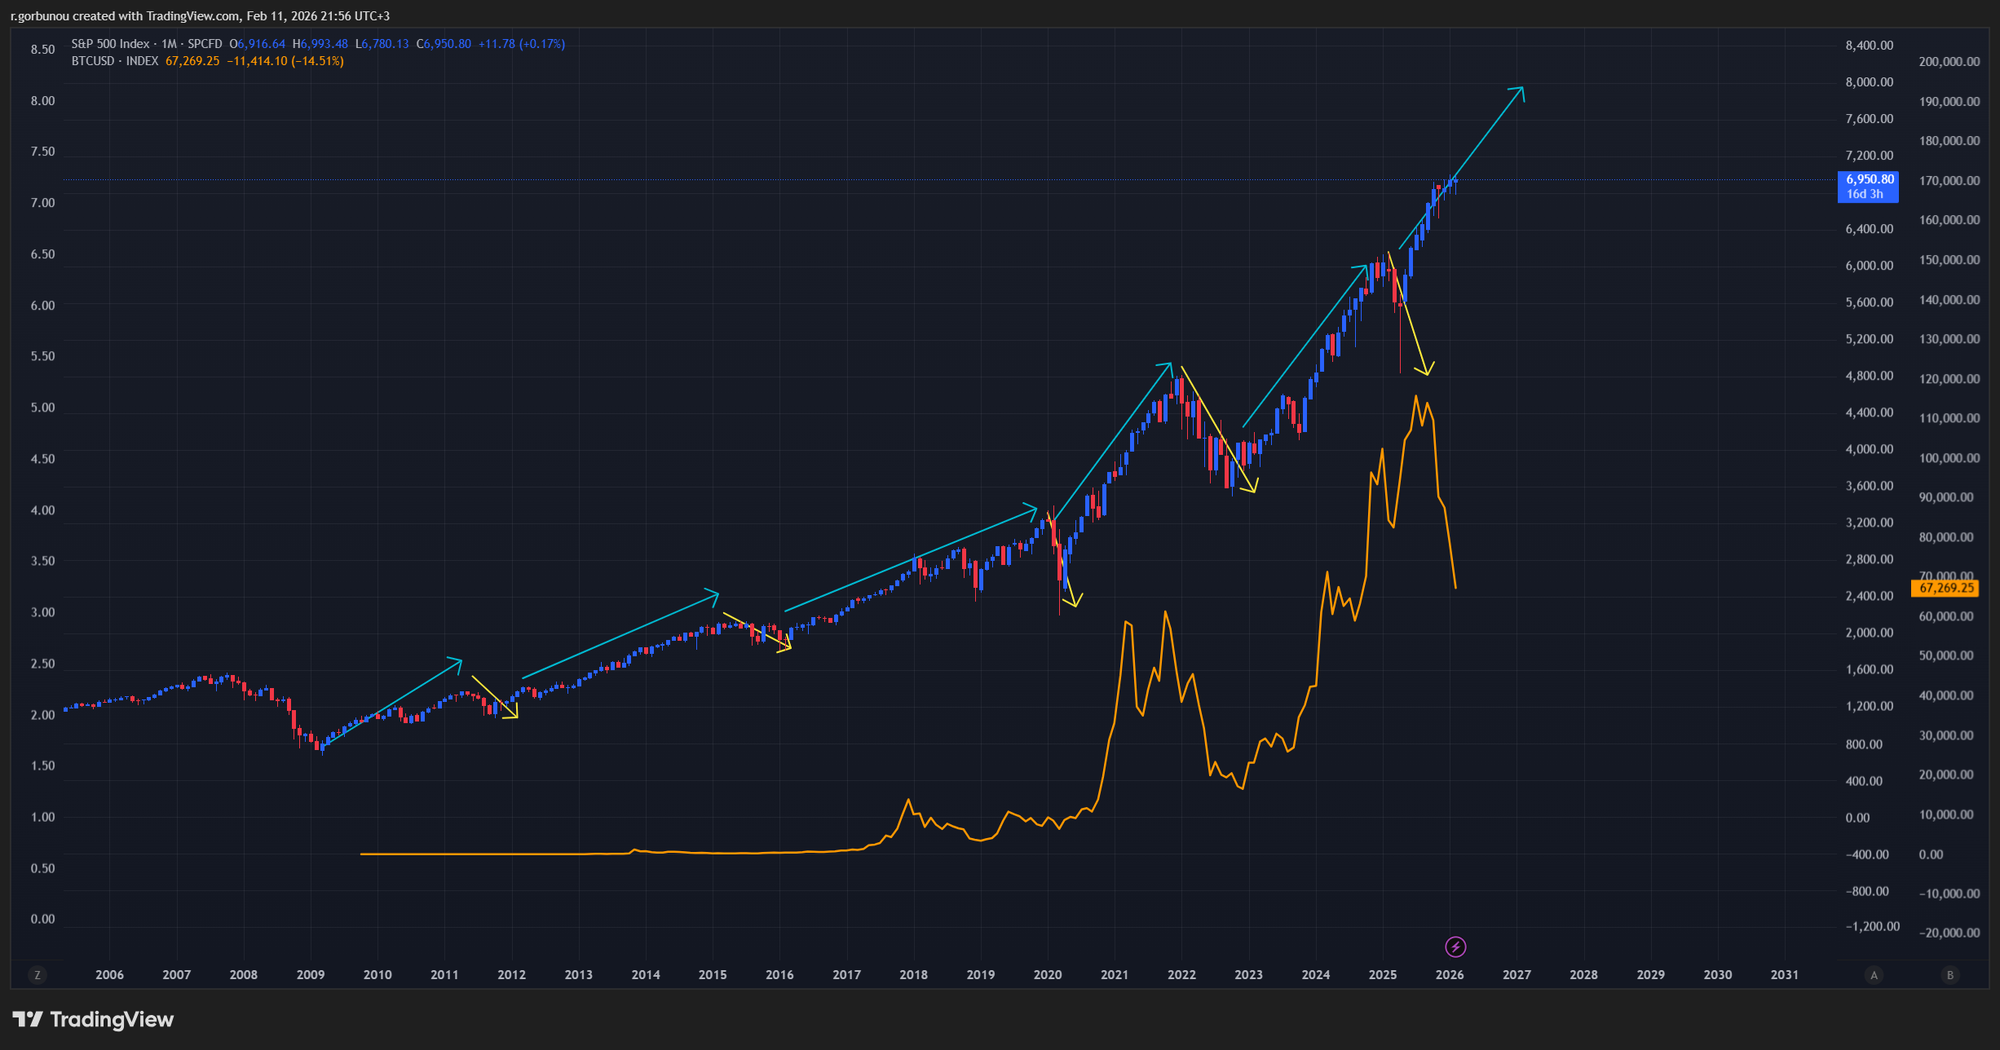
- Historical Convergence (2016–2024): During this period, Bitcoin functioned as a "High-Beta Tech Stock." Every major expansion in Global M2 liquidity fueled a synchronized rally where Bitcoin amplified the gains of the S&P 500.
- The 2026 Decoupling: Recent performance reveals that decoupling is one of many major indicators suggesting Bitcoin may have entered a bear cycle. As the S&P 500 pushed toward the 7,000 level fueled by concentrated AI-sector wealth, Bitcoin entered a corrective phase, dropping to a local low of $60,000 as of today—a 52% correction from its cycle high. This decoupling represents a bearish divergence; whereas in previous cycles, Bitcoin typically led the S&P 500 upward, the 2026 anomaly of the S&P 500 leading Bitcoin downward or sideways is a historic shift that confirms a structural bear cycle.
- Institutional Liquidity Dynamics: While Bitcoin is often debated as a "Digital Gold" risk-off asset, institutional behavior is governed by risk-management mandates. In periods of market turbulence, Bitcoin's high liquidity makes it a primary source for immediate cash. Because digital assets can be exited instantly compared to real estate or private equity, wealth managers often sell Bitcoin first to fund margin calls or offset losses in other sectors. According to Fidelity’s 2025 Digital Asset Study, institutional allocations remain in the 1%–5% "risk-on" bucket, reinforcing its status as a high-velocity liability during equity panics.
- Outcome: The breakdown in correlation indicates Bitcoin is currently functioning as a source of liquidity to fund concentrated equity bets rather than rising with the general market tide. This dispersion confirms that the equity "Wealth Effect" is currently occurring at the structural expense of crypto liquidity.
2.2 Bitcoin vs US Dollar Liquidity
The long-term performance of Bitcoin and the broader crypto market is fundamentally linked to global liquidity flows. Chart analysis confirms that the crypto market exhibits consistent growth when Global Liquidity (including Federal Reserve and PBOC Balances) expands over extended timeframes (e.g., 2018–2026). This section details the structural dependency of digital assets on liquidity and utilizes lag analysis to identify the timing of cycle reversals.
The Dependency Framework
- Long-Term Growth Correlation: Over multiple cycles (2018-2019, 2019-2021, and 2021-2026), the crypto market has consistently grown during periods of central bank balance sheet expansion (Fed + PBOC), though price action always requires a significant time-lag to manifest.
- Settlement & Policy Link: Much of Bitcoin's trading volume is settled in USD-pegged stablecoins. This architecture ties digital asset performance directly to the Federal Reserve's liquidity profile; when the dollar's availability shifts, crypto reacts with high-velocity volatility.
- Yield Competition: Bitcoin competes for "idle capital." When real yields (nominal interest rates minus inflation) are high, investors prefer "safe" assets. If "safe" bond returns fail to beat inflation, capital is eventually forced into crypto to preserve purchasing power.
- Monetary Cycle Mechanics: Crypto enters parabolic phases during global balance sheet expansions (QE) and severe drawdowns during contractions (QT), as central banks reduce systemic liquidity and bank reserves.
The Mechanics of Timing: Liquidity Transmission Lag
Identifying mechanical delays between policy shifts and price action is essential for timing the start of the next bull cycle, rather than identifying the absolute terminal bottom. It is crucial to distinguish between a Price Bottom and the Next Expansion:
- Price Bottom (Exhaustion of Sellers): Represents the level where the "bleeding stops." It is often driven by technical support or leverage flushes. A market can hit a price bottom and remain in a sideways accumulation phase for months while waiting for an impulse.
- Next Expansion (Empowerment of Buyers): Represents the "engine restart." This is driven by fresh liquidity moving through the system. Our goal is to identify the moment when liquidity arrives to fuel the vertical move.
- Leading Indicator of Liquidity Direction: Bitcoin topped in October 2025, front-running the Federal Reserve pivot in December 2025. This timing identifies Bitcoin as a leading indicator of liquidity drain. Institutional capital rotated out of crypto two months before the liquidity bridge was established, sensing the impending withdrawal of support.
- The 110-Day Crypto Lag (David Duong, Coinbase): Regression models show the highest correlation between Bitcoin and Global M2 occurs with a 110-day lag. This represents the time required for capital to move from institutional cash accounts into digital asset markets.
- The 26-Week Equity Lag (Michael Howell, CrossBorder Capital): This model suggests that broad equities and global risk assets trade on stale liquidity conditions from roughly 180 days (26 weeks) prior. This explains why the S&P 500 remained buoyant on old liquidity while crypto began reacting to the current tighter regime.
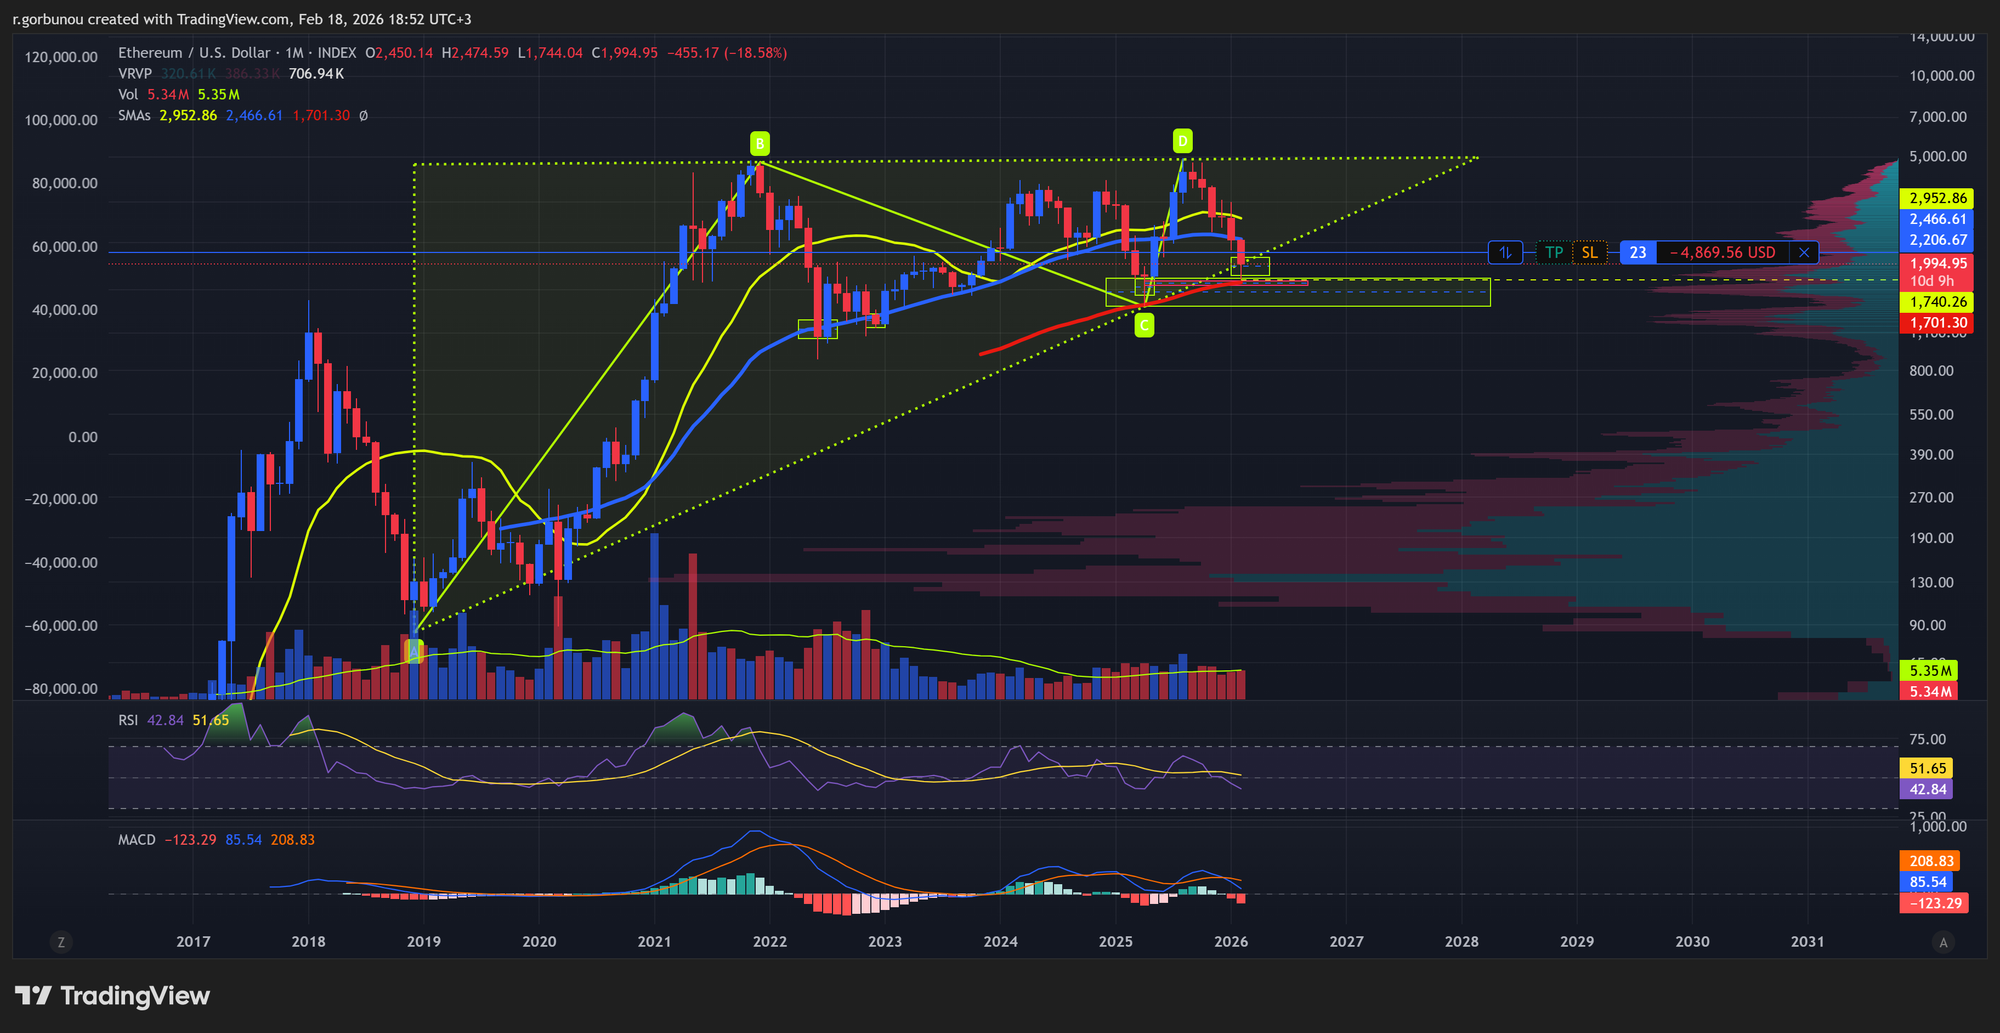
The Behavioral Pivot: Point B and the Lag Zone
The delay in market reaction is driven by the internal mechanics of the financial system.
- The "Lag Zone" Mechanics: The Lag Zone is the operational delay (110-180 days) between a liquidity shift and the actual movement of money into the market. During this window, banks first use new liquidity to settle their own internal debts and strengthen reserves. Speculative money only flows into Bitcoin once the banking core is fully stabilized and investors begin reaching for higher returns.
- The Point B Target (Real Yield Zero-Bound): Reaching Point B is the behavioral inflection point where Real Yields (Nominal Rate - Inflation) drop to 0% or lower. Reaching this coordinate marks the termination of the liquidity lag because it removes the final justification for staying in "safe" cash. When cash yields are negative in real terms, investors are forced to leave "safe" cash and migrate toward risk assets, triggering the vertical bull impulse.
Current Cycle Status (Feb 15, 2026)
As of today, we are approx. 75 days into the 110-day lag window following the early December pivot. The market remains stuck in the Lag Zone because Real Rates have increased from 1.2% in December 2025 to 1.24% today.
- The Speculative Inflation Paradox: In the context of Bitcoin, falling inflation is currently a bearish signal because the Fed is slow to cut nominal rates. While inflation is dropping (the "Last Mile"), the Real Rate is rising, increasing the profit for holding cash in Money Market Funds (safe mutual funds investing in short-term debt).
- Monitoring the Lag: Because holding cash still provides a "real profit," the pressure to move into Bitcoin hasn't triggered yet. To end the lag, the Fed must cut nominal rates faster than inflation is falling. Based on the 110-day model, the "Point B" trigger for a bull cycle is not expected until late March 2026.
Outcome & Bear Market Assessment
The combination of the 52% price correction to $60,000 and the ongoing decoupling from the S&P 500 provides strong support for a structural bear market hypothesis. This analysis treats liquidity dependency not as a bottom-finding tool, but as a framework for understanding the timing of the next expansion.
If the 110-day lag (late Q1 2026) fails to trigger a recovery, it confirms that nominal rate cuts are not yet outpacing inflation, preventing the Point B (Real Yield Zero-Bound) transition. Under these conditions, the market cycle remains bearish until the "real" cost of holding cash collapses. Subsequent sections (2.3 and higher) will analyze further indicators to verify if the market is indeed in a structural bear cycle and identifying potential structural reversal signals.
2.3 BTC Bear Market Cycle Periods
Analyzing historical bear cycles allows us to evaluate the current market trajectory against established timeframes and structural triggers. This comparative study helps determine whether the 2025–2026 price action follows a standard cyclical reset or indicates a faster regime shift.
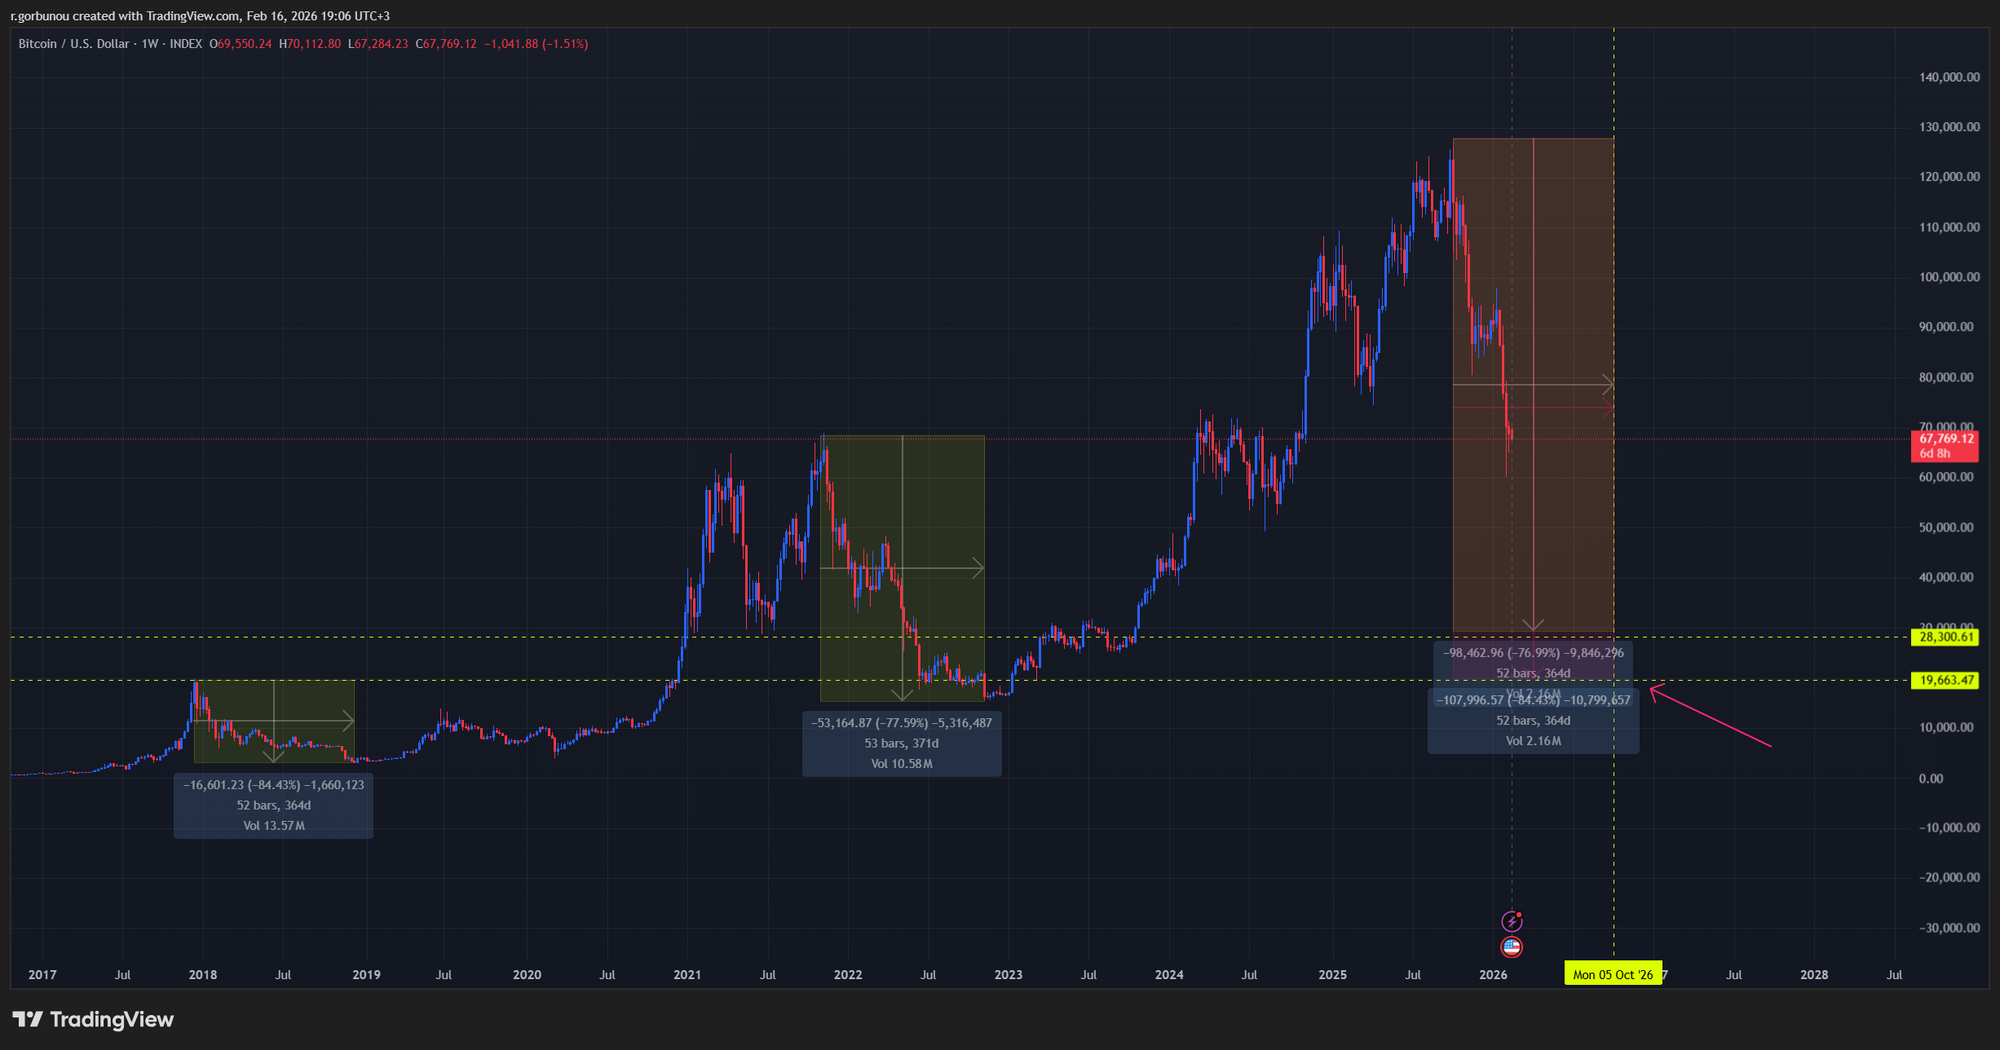
1. 2017–2018 bear cycle
- Highest value: Around $20,000 in December 2017.
- Lowest value: Approximately $3,200 in December 2018.
- Duration of price drop: The decline lasted for roughly one year, or about 365 days.
- Triggers:
- Regulatory pressure: Major global entities, including the U.S. Securities and Exchange Commission, began cracking down on the unregulated Initial Coin Offering (ICO) market that flourished in 2017.
- Exchange hacks: High-profile hacks, such as the major security breach of the Japanese exchange Coincheck in January 2018, eroded investor confidence in the security of crypto holdings.
- Social media bans: Tech giants like Facebook and Google restricted cryptocurrency-related advertising, contributing to the negative market sentiment.
- Lack of fundamentals: The 2017 bull run was heavily driven by speculation, and with no solid fundamental indicators to anchor valuations, fear took over and accelerated the sell-off.
2. 2021–2022 bear cycle
- Highest value: Around $69,000 in November 2021.
- Lowest value: Approximately $15,476 in November 2022.
- Duration of price drop: The fall from the all-time high took around 367 days.
- Triggers:
- Macroeconomic environment: A major factor was the rising global inflation, which led the U.S. Federal Reserve and other central banks to aggressively hike interest rates. This made "risk-off" assets like cryptocurrencies less attractive compared to safer investments.
- Terra/LUNA collapse: The failure of the Terra algorithmic stablecoin ecosystem in May 2022 caused a catastrophic loss of confidence and triggered a ripple effect throughout the crypto market.
- FTX bankruptcy: The sudden collapse of one of the largest cryptocurrency exchanges, FTX, in November 2022, revealed mismanagement and misuse of customer funds. This caused widespread contagion, liquidity crises, and further destroyed investor trust.
- Heavy leverage: Many crypto funds and lenders had relied on risky and highly leveraged business models that were exposed as the market turned, forcing large-scale liquidations and exacerbating the downward pressure.
3. 2025-2026 Potential bear cycle (ongoing)
- Highest value: Around $126,000 in October 2025.
- Lowest value (extrapolated):$28,300 -$19,600 (Projected October 2026)
- Duration of price drop: 365 days (Projected).
- Triggers:
- Historic Leverage Flush: The market suffered a catastrophic $19 billion liquidation event in late 2025—the largest in crypto history—which effectively wiped out speculative "froth" and destroyed the momentum required to maintain prices above $100,000.
- Geopolitical and Trade Headwinds: Renewed U.S. tariff threats (initially 10% rising to 25%) on European nations have triggered a broad "risk-off" sentiment across global markets, causing investors to exit high-beta assets like Bitcoin.
- Aggressive Institutional De-risking: U.S. spot Bitcoin ETFs experienced their worst two-month stretch on record in late 2025, followed by a massive $1.33 billion outflow in the week ending January 23, 2026, signaling structural exits by large-scale allocators.
- Restrictive Monetary Policy: Despite earlier hopes for aggressive cuts, the Federal Reserve has maintained a neutral interest rate stance (3.5%–3.75%) into early 2026, strengthening the U.S. dollar and reducing the appeal of non-yielding assets.
- Regulatory Compliance Shocks: The enforcement of the GENIUS Act’s strict 1:1 reserve mandates and Europe’s MiCA/DAC8 protocols has eliminated high-leverage "shadow banking" and ended transaction anonymity, triggering massive institutional and retail capital flight from centralized platforms.
Comparative Analysis & Conclusion
The historical data reveals a striking "Rule of 365 Days" for price discovery, but the 2025–2026 period introduces critical changes in internal mechanics.
1. Accelerated Drop Velocity & Strategic Concerns In previous cycles (2018, 2022), Bitcoin typically required 6–8 months to reach a 50% correction. In the current cycle, Bitcoin has covered almost half the distance to the extrapolated bottom in only ~130 days.
- The Concern: This increased velocity suggests a significantly more efficient de-risking environment. Institutional efficiency has replaced retail drift, meaning the "Price Bottom" (sellers' exhaustion) may be reached much faster than the "Next Expansion" (the liquidity engine). This creates the risk of a "Dead Zone" where price stays at extreme lows for a prolonged period while waiting for the liquidity lag to end.
2. Sample Size Constraint & Analytical Validity It is important to note that this pattern is extrapolated from only the three most recent bear cycles. Many analysts argue that three data points are statistically insufficient to define a permanent rule for Bitcoin. However, we acknowledge this remark and utilize these markers as the most relevant map currently available to navigate the market's volatility.
3. Summary If the historical 1-year duration holds, a structural floor is unlikely until October 2026. The verticality of the current drop confirms we are in a high-velocity bear regime where institutional speed dictates price discovery. We will continue to analyze further indicators in Section 2.4 to verify if this accelerated pace confirms the bear cycle or signals an earlier-than-expected terminal bottom.
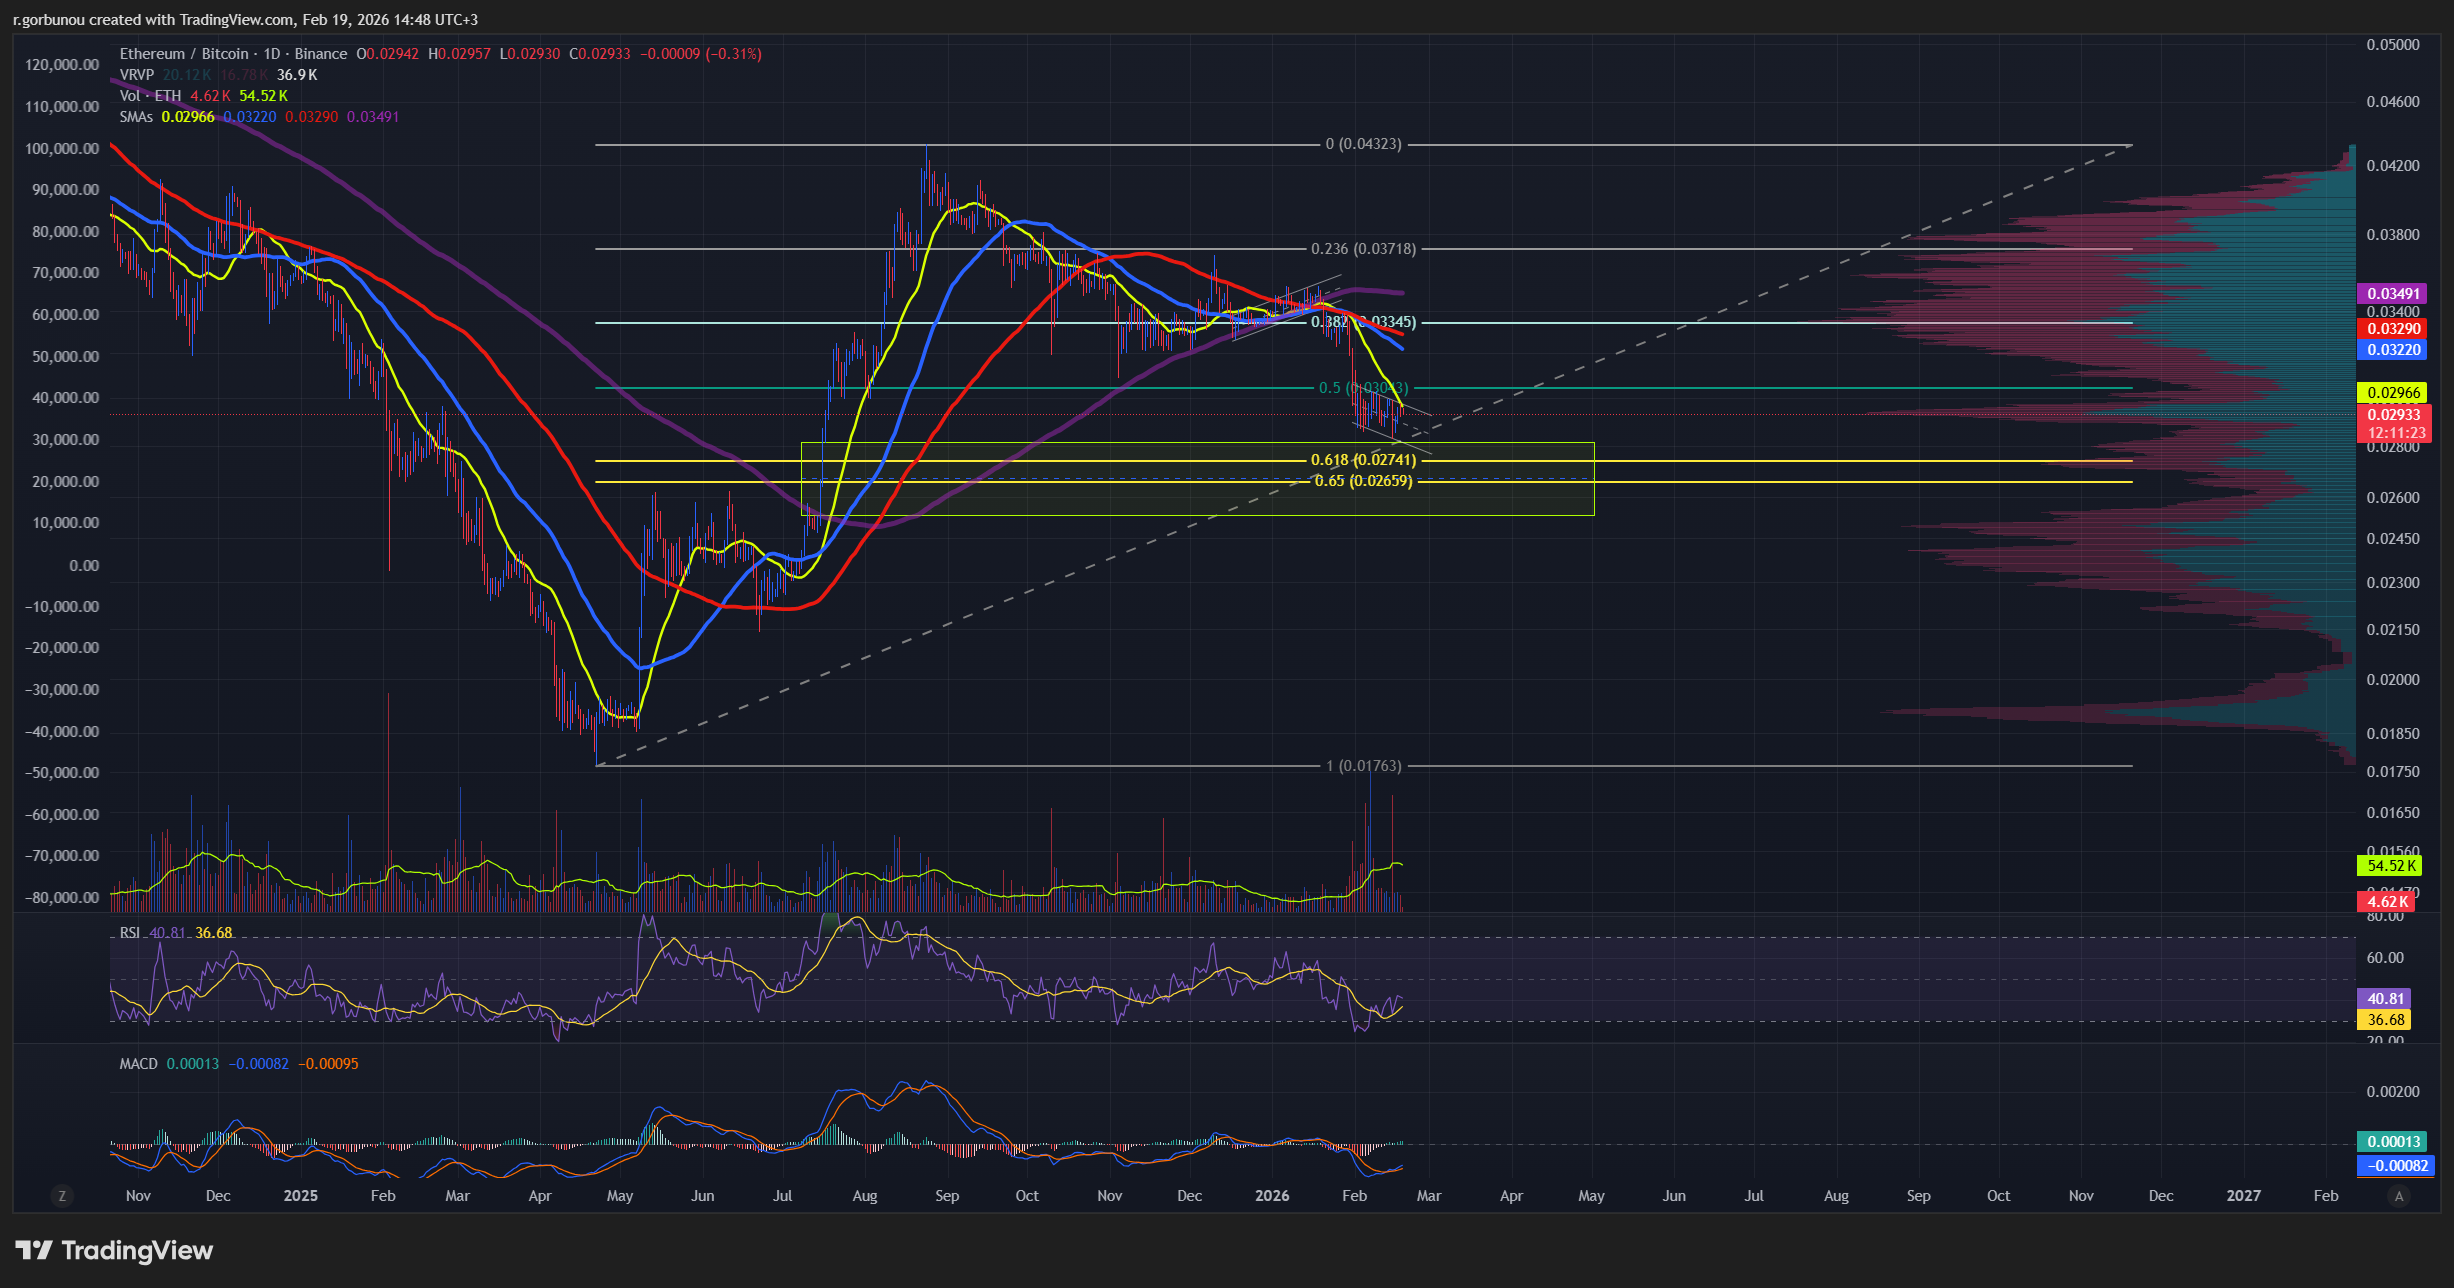
2.4 Bitcoin vs. US Dollar Index (DXY)
The relationship between Bitcoin and the US Dollar Index (DXY) provides a critical cross-asset signal for liquidity flow. Analysis of the latest chart data reveals a complex interplay between sovereign currency strength and digital asset valuation.
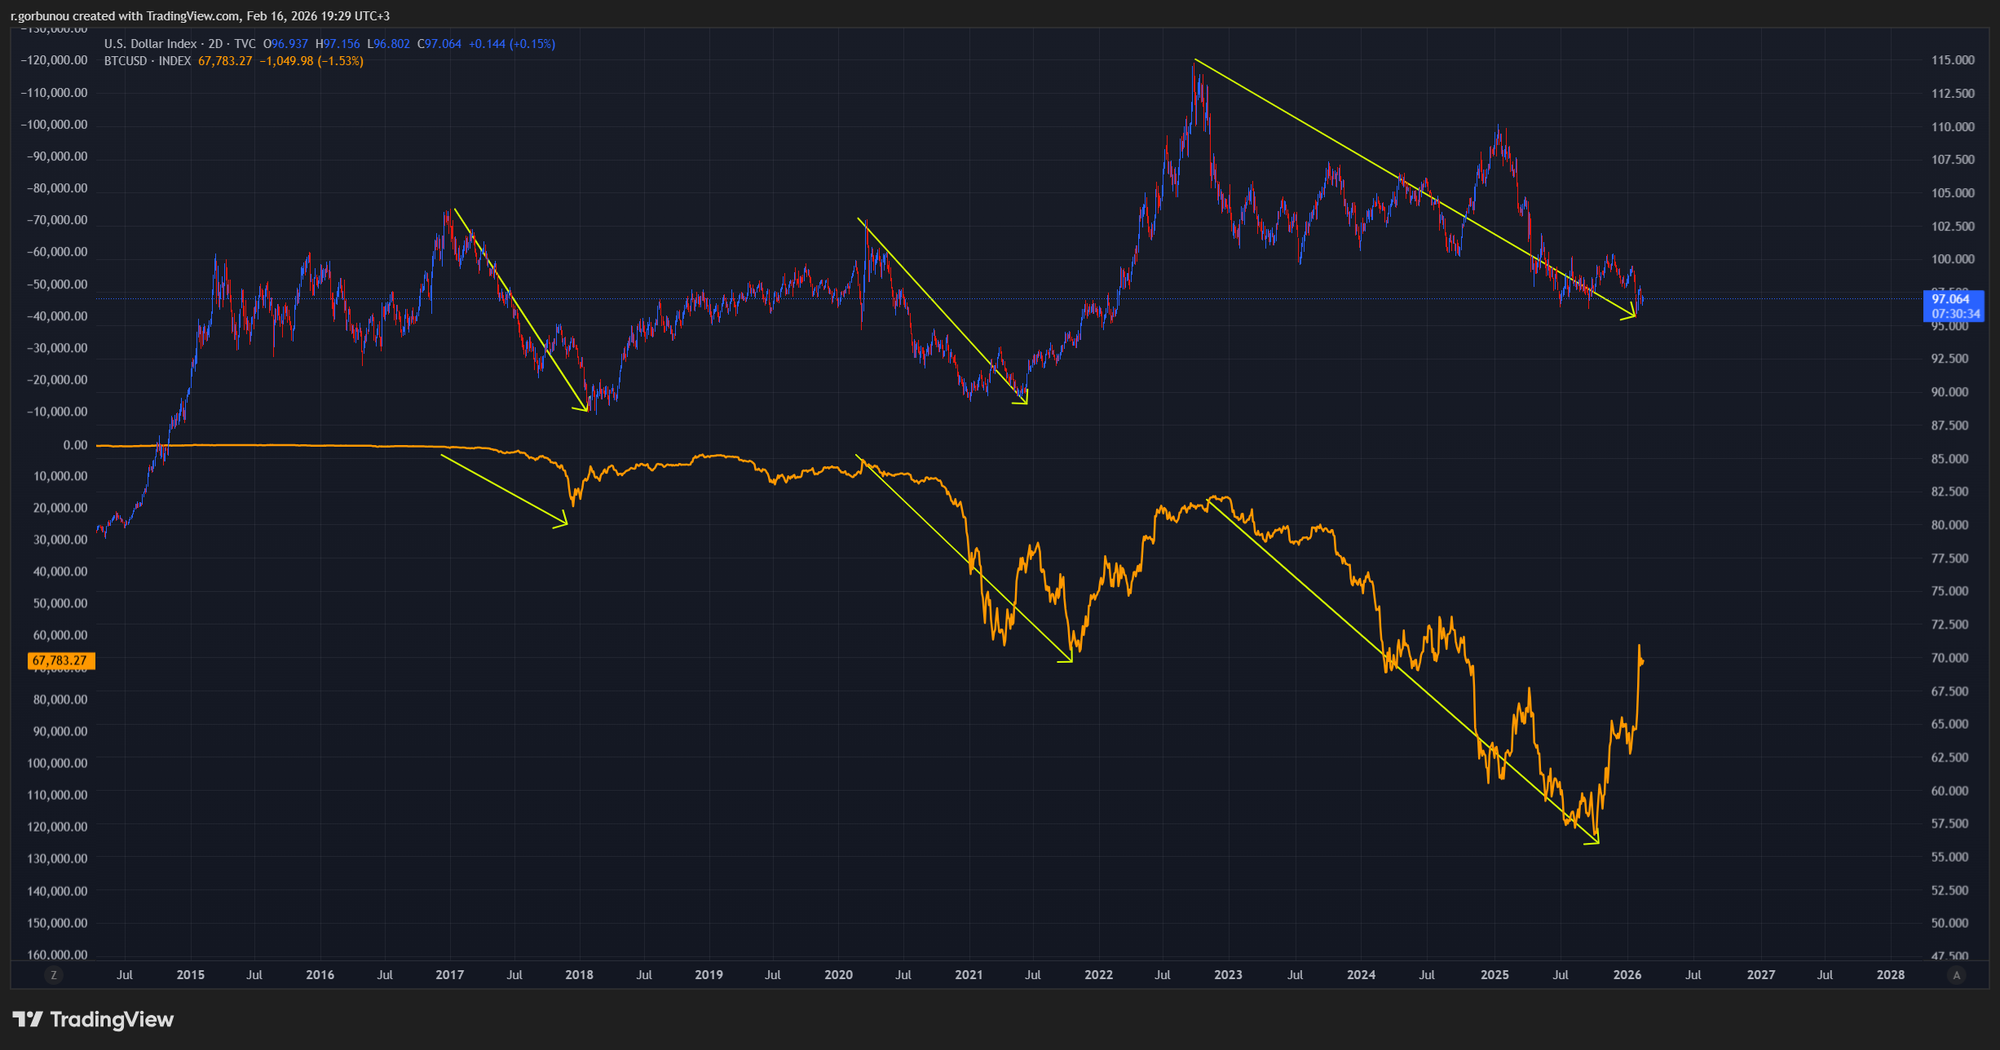
The Inverted Correlation Thesis
Historically, there is a persistent inverse relationship between the US Dollar Index and Bitcoin. When the dollar weakens, it typically signals a period of global liquidity expansion. Current technical markers show the DXY trading around 97.064, suggesting a high probability of continued weakness into mid-2026. Under this thesis, Bitcoin functions as a "liquidity sponge," rising as investors move capital out of a depreciating dollar and into scarce digital assets.
The "Risk-On" Bottleneck and the Gold Cap
Despite the weakening dollar, a major obstacle prevents Bitcoin from capturing this escaping liquidity: its categorization as a "high-beta risk-on" asset.
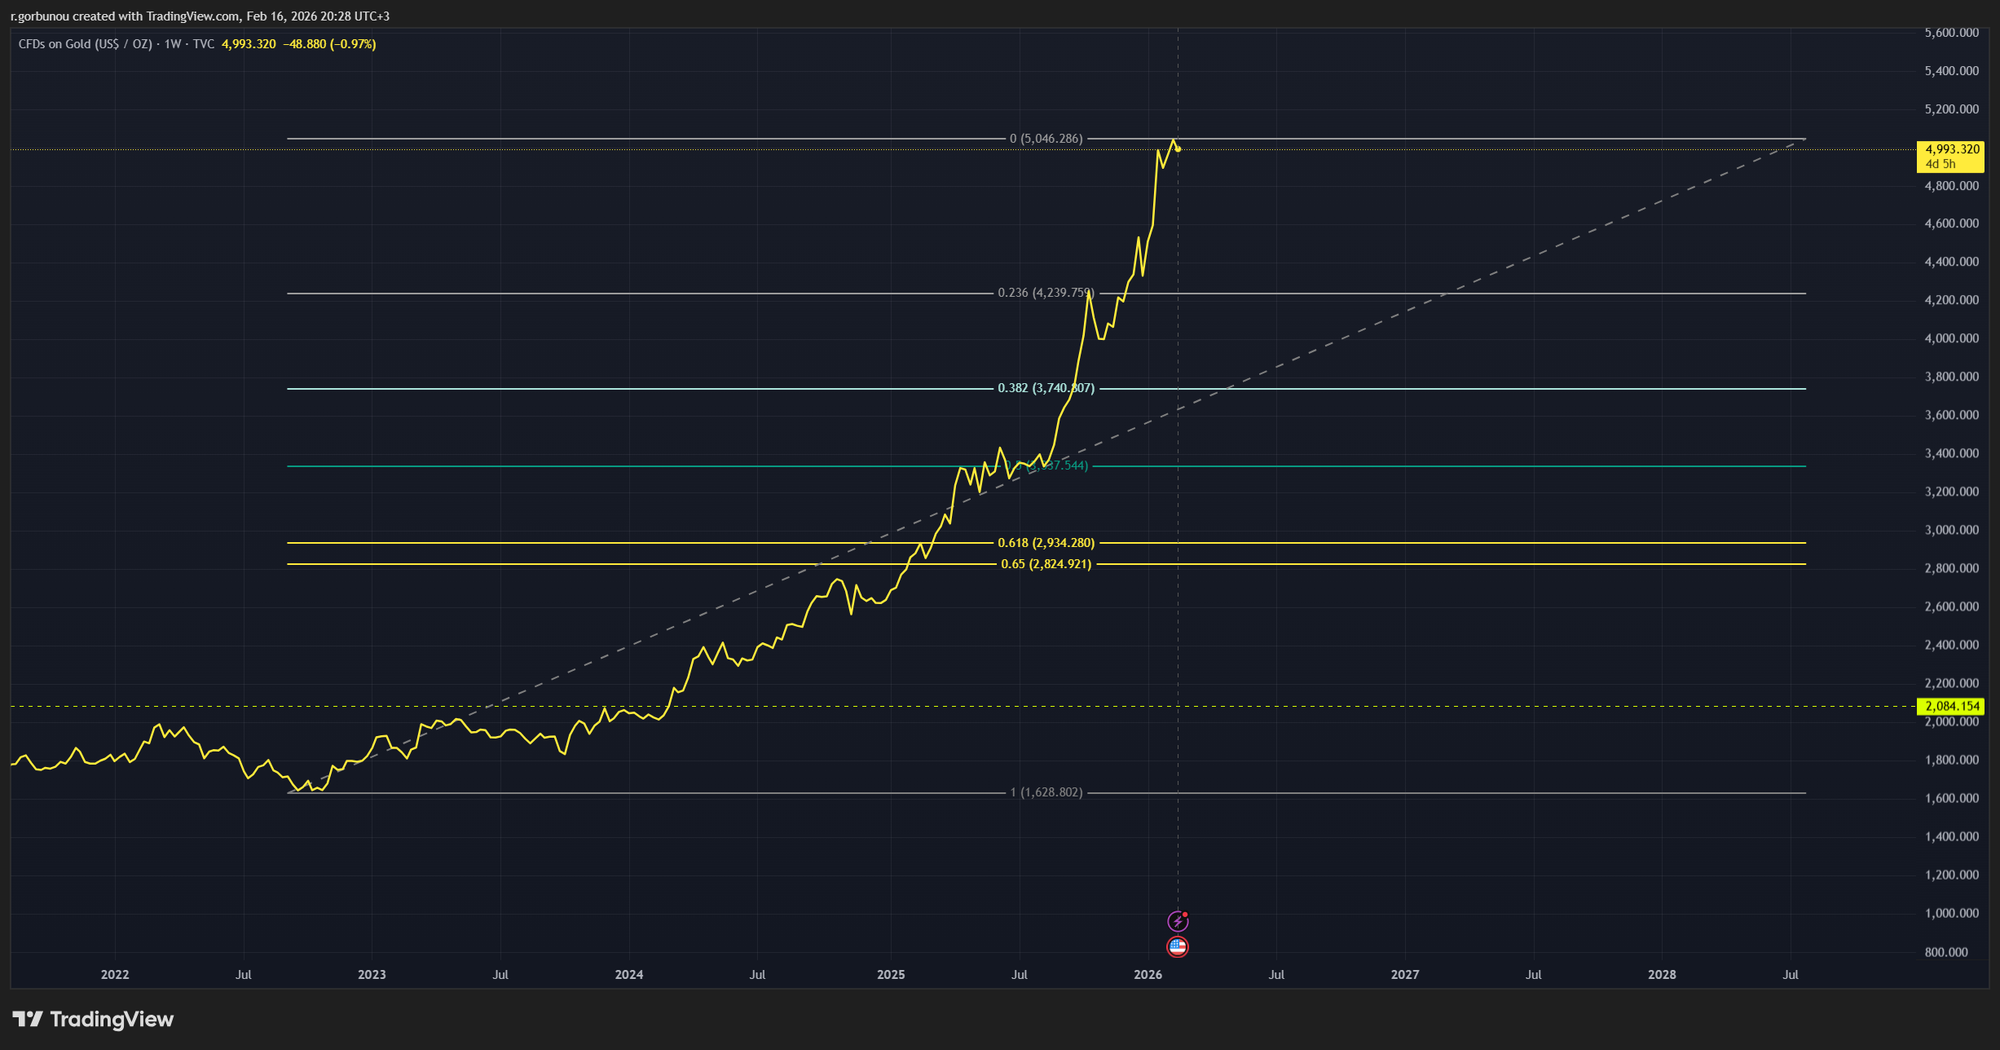
- Gold at the Peak: Analysis of the GOLD chart shows price action trading around the historical top of $4,993, effectively hitting a major Fibonacci extension. This confirms that capital leaving the dollar has settled into the ultimate defensive asset (Gold) rather than speculative digital markets.
- Rotation Potential: If Gold begins to stall or correct at this extreme level while the DXY continues its decline, we may see a rotation of this "parked" capital back into high-beta assets like Bitcoin, provided broader risk appetite returns.
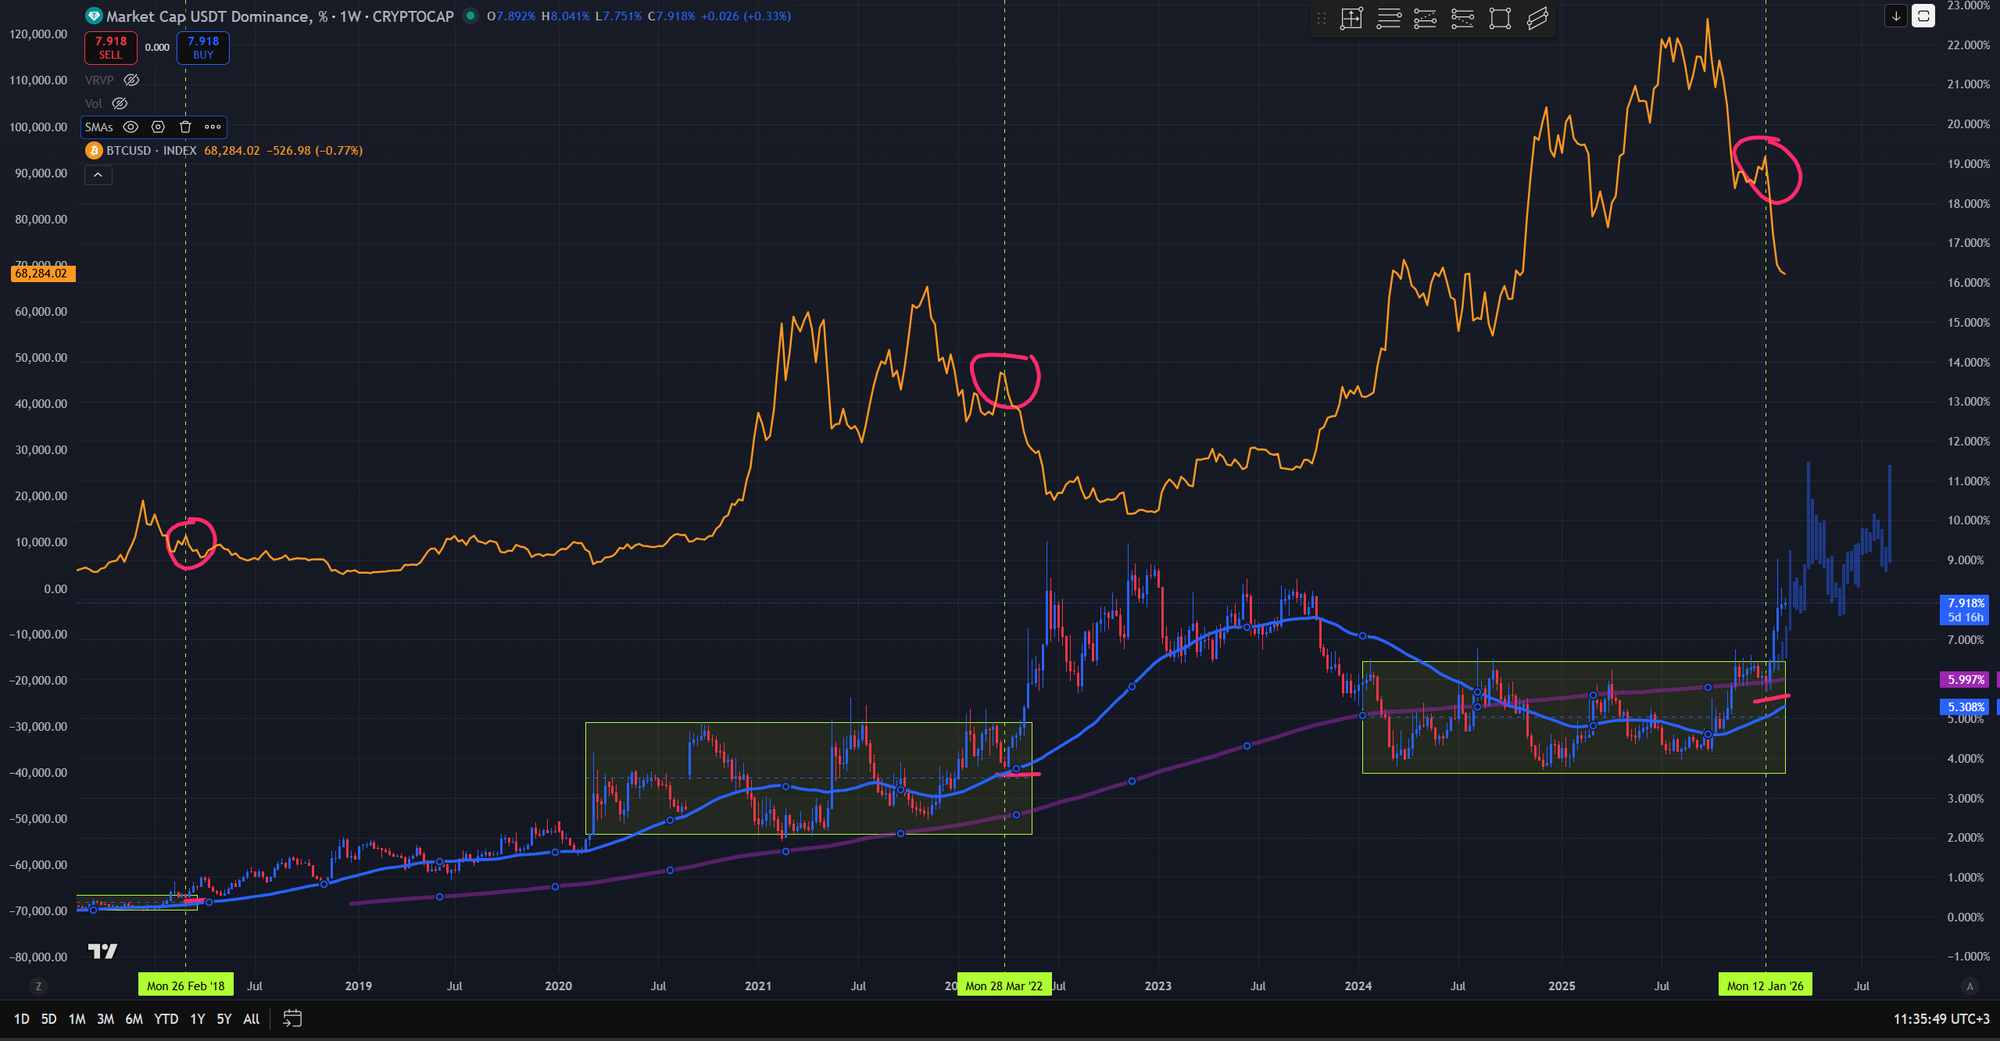
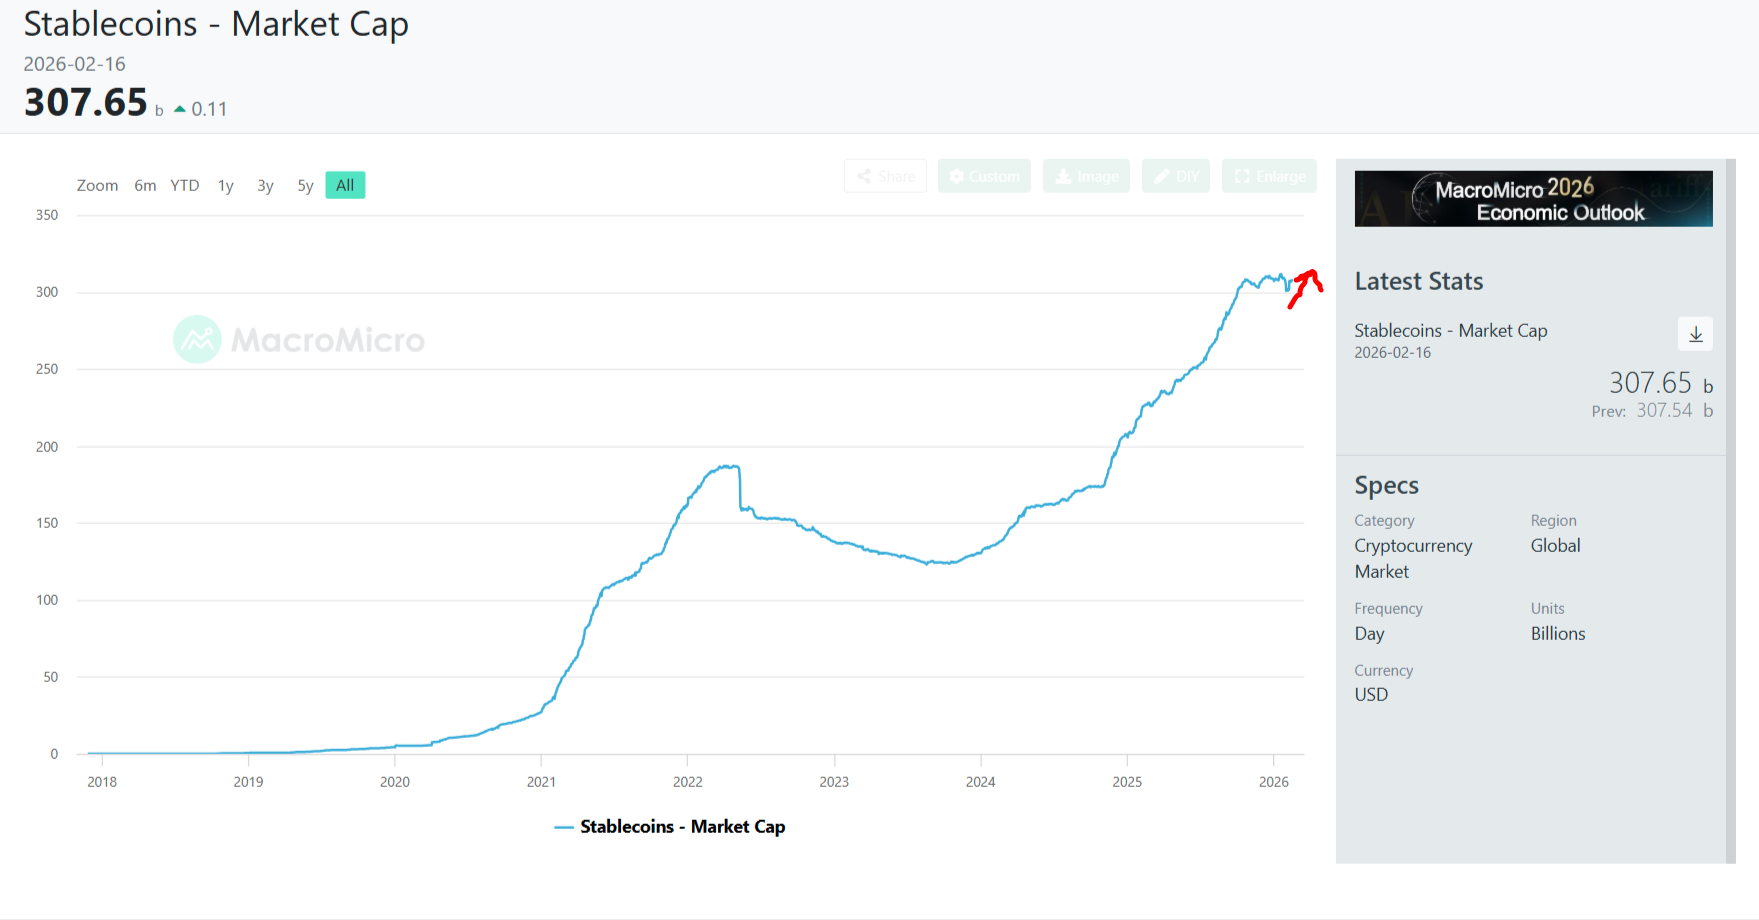
Stablecoin Accumulation: The "Dry Powder" Signal
Latest stats reveal the Stablecoin Market Cap has reached $307.65B, with a significant spike observed on February 7-8, 2026. This surge in stablecoin liquidity represents "dry powder" sitting on the sidelines. In a bear market, this accumulation typically acts as a lead indicator for a short-term relief rally. Investors are moving into dollar-pegged assets to avoid volatility, waiting for a definitive technical breakdown in the DXY to redeploy into Bitcoin.
Technical Signal: The Funding-DXY Squeeze
A powerful signal for an immediate short-term relief rally occurs when Negative Bitcoin Funding Rates coincide with a DXY technical breakdown.
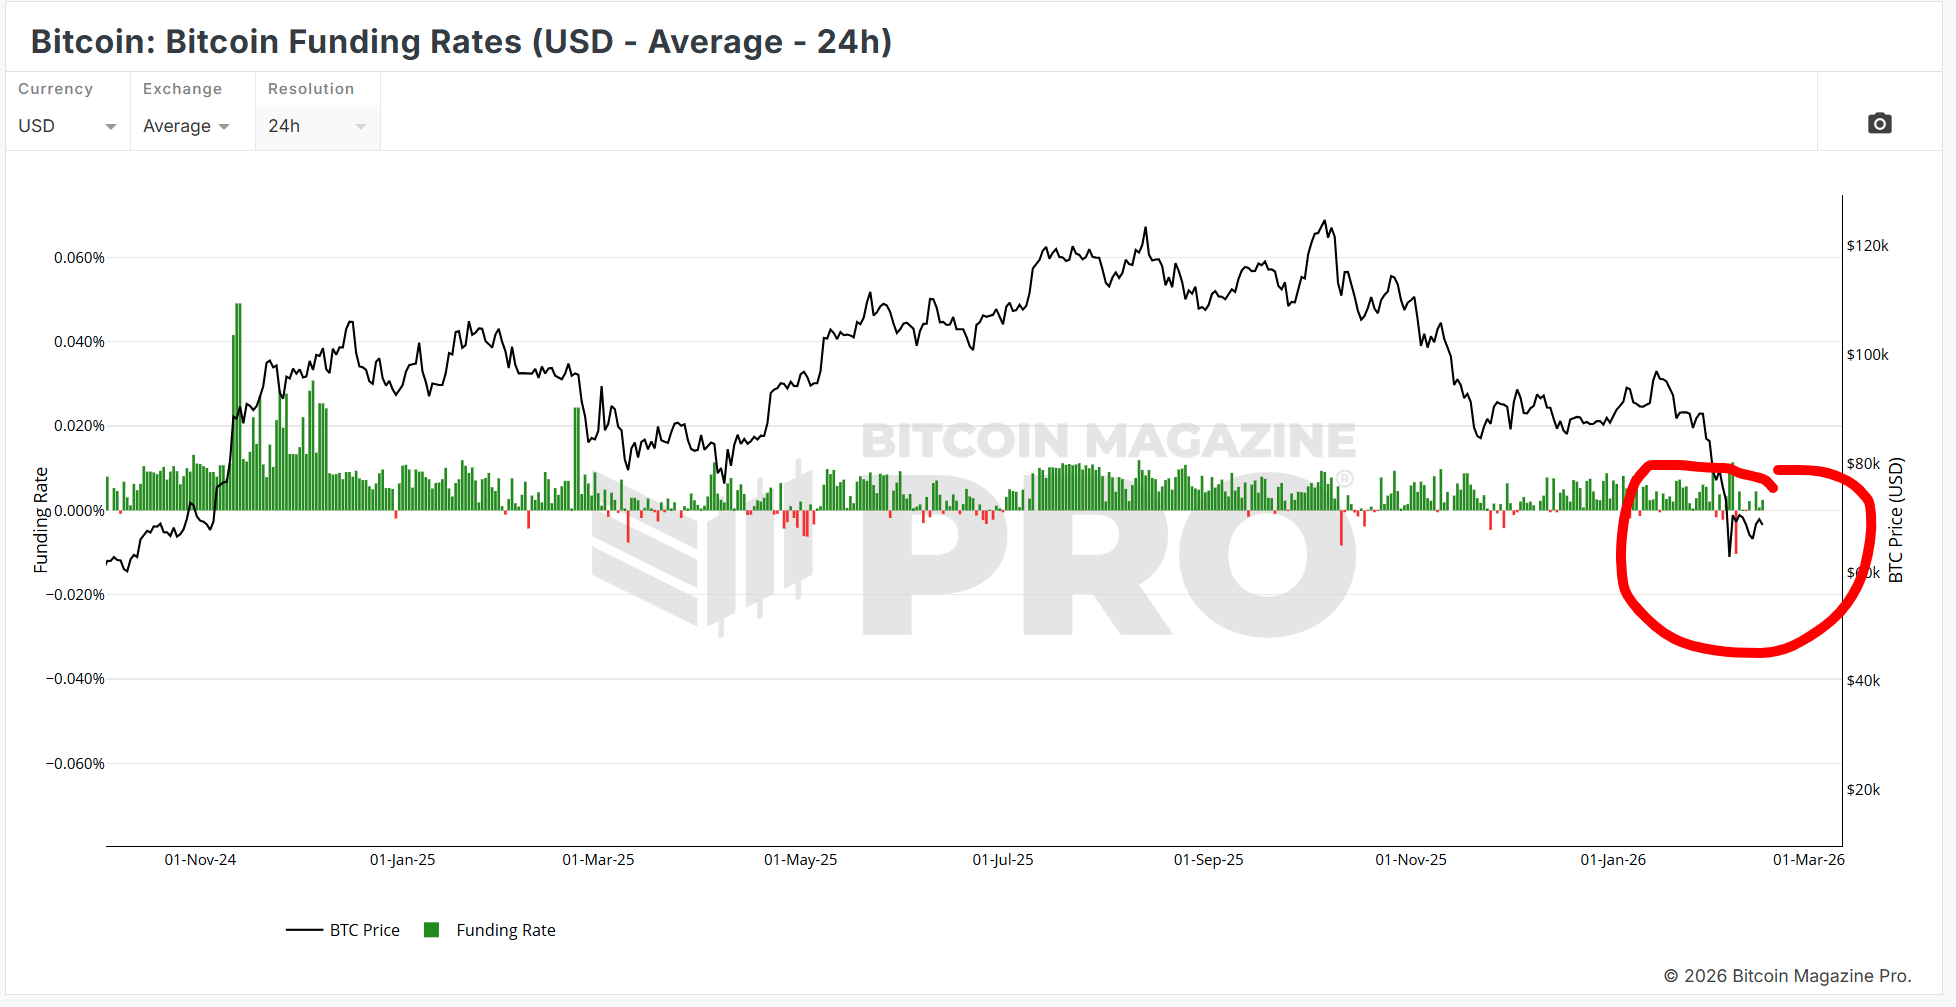
A powerful signal for an immediate short-term relief rally occurs when Negative Bitcoin Funding Rates coincide with a DXY technical breakdown.
Conclusion: DXY as a Liquidity Buffer
While the probability of a falling DXY provides a necessary counter-argument to a permanent bear market thesis, it does not fully eliminate the structural risks identified in previous sections. The dollar's weakness, combined with the $307B stablecoin reserve and the recent pivot to negative funding rates, acts as a "liquidity buffer" that may slow the rate of Bitcoin's correction and fuel short-term relief rallies. However, until the "Risk-On Bottleneck" is cleared and capital rotates out of the Gold peak, Bitcoin is expected to underperform relative to the dollar’s decline as escaping liquidity continues to bypass speculative digital markets in favor of defensive alternatives.
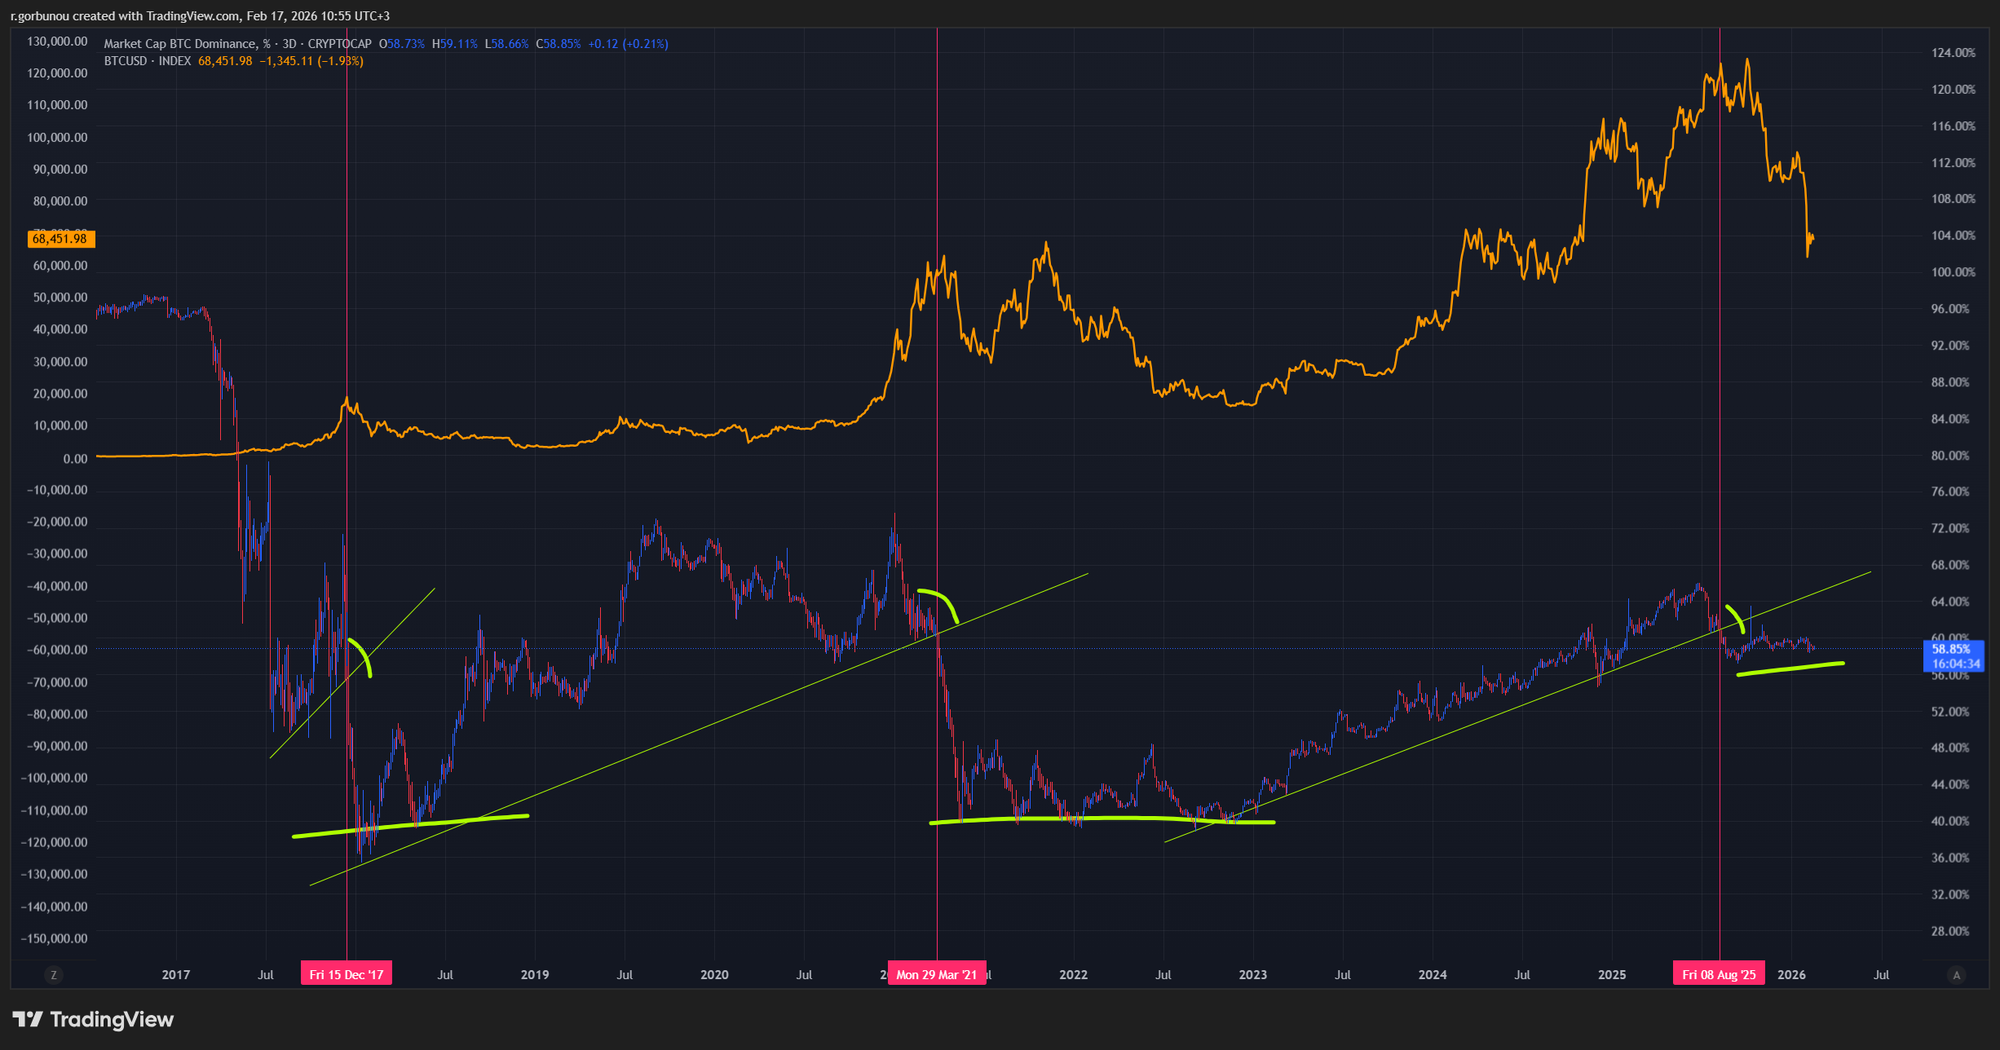
2.5 BTC Price Pattern: The Channel Breakdown Trap (2023-2026)
Evaluating the geometric structure of Bitcoin's price action reveals a significant technical failure that corroborates the structural bear cycle hypothesis. The current chart exhibits a breakdown of a multi-year recovery trend, signaling a regime transition.
The Breach of the Ascending Parallel Channel
Bitcoin was guided by a clear Ascending Parallel Channel from early 2023 until late 2025, providing the structural framework for the post-FTX recovery. However, recent price action reveals a definitive Lower Boundary Breach. Unlike previous tests of support, this breach occurred with high velocity and no subsequent relief rally (no "bump"). The price pierced the bottom rail and moved vertically lower, signaling a volatility expansion to the downside that invalidated the three-year trend.
Retesting the 200-Week EMA: The Immediate Defense
Following the channel breach, the price has dropped directly to retest the 200-week Exponential Moving Average (EMA), currently situated near $68,000.
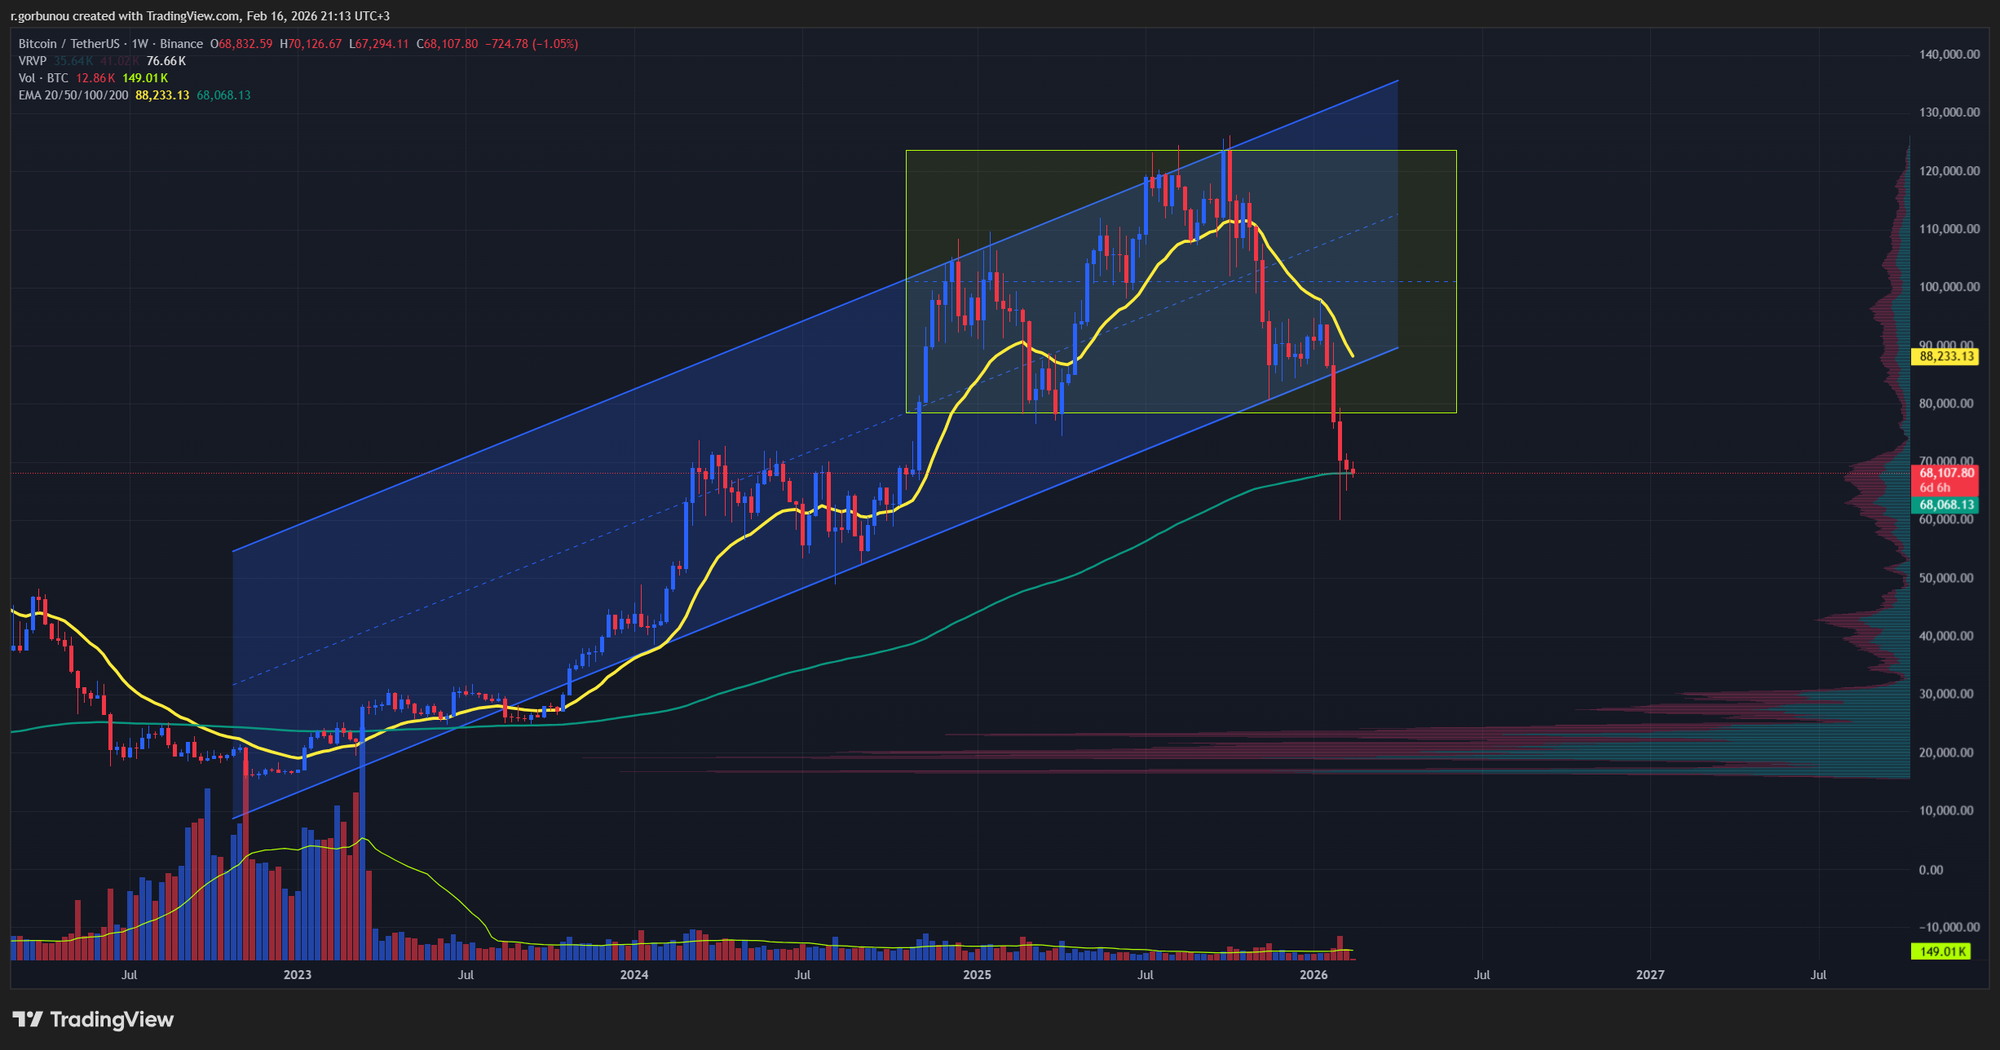
- Current Status: Price action is currently interacting with this level. In a standard bear cycle transition, this EMA serves as the first major line of defense. However, the lack of a "bump" rally following the channel break suggests that the momentum of the breakdown is overwhelming immediate buy-side interest.
- The Conditioning Trap: This setup is a "trap" because it uses the psychological reflex of "buying the dip" at major support levels to capture late-cycle participants. Dip-buyers entered at the channel bottom and are now entering at the 200-week EMA, believing these long-term levels will hold.
The 200-Week SMA: The Bear Market "Seal" and Multi-Year Implications
While the 200-week EMA is currently being tested, the 200-week Simple Moving Average (SMA), currently near $58,371 (the purple line on charts), remains the ultimate technical magnet. Reaching and targeting this level is not merely a deeper correction; it is the catalyst for a multi-year bear cycle for three critical reasons:
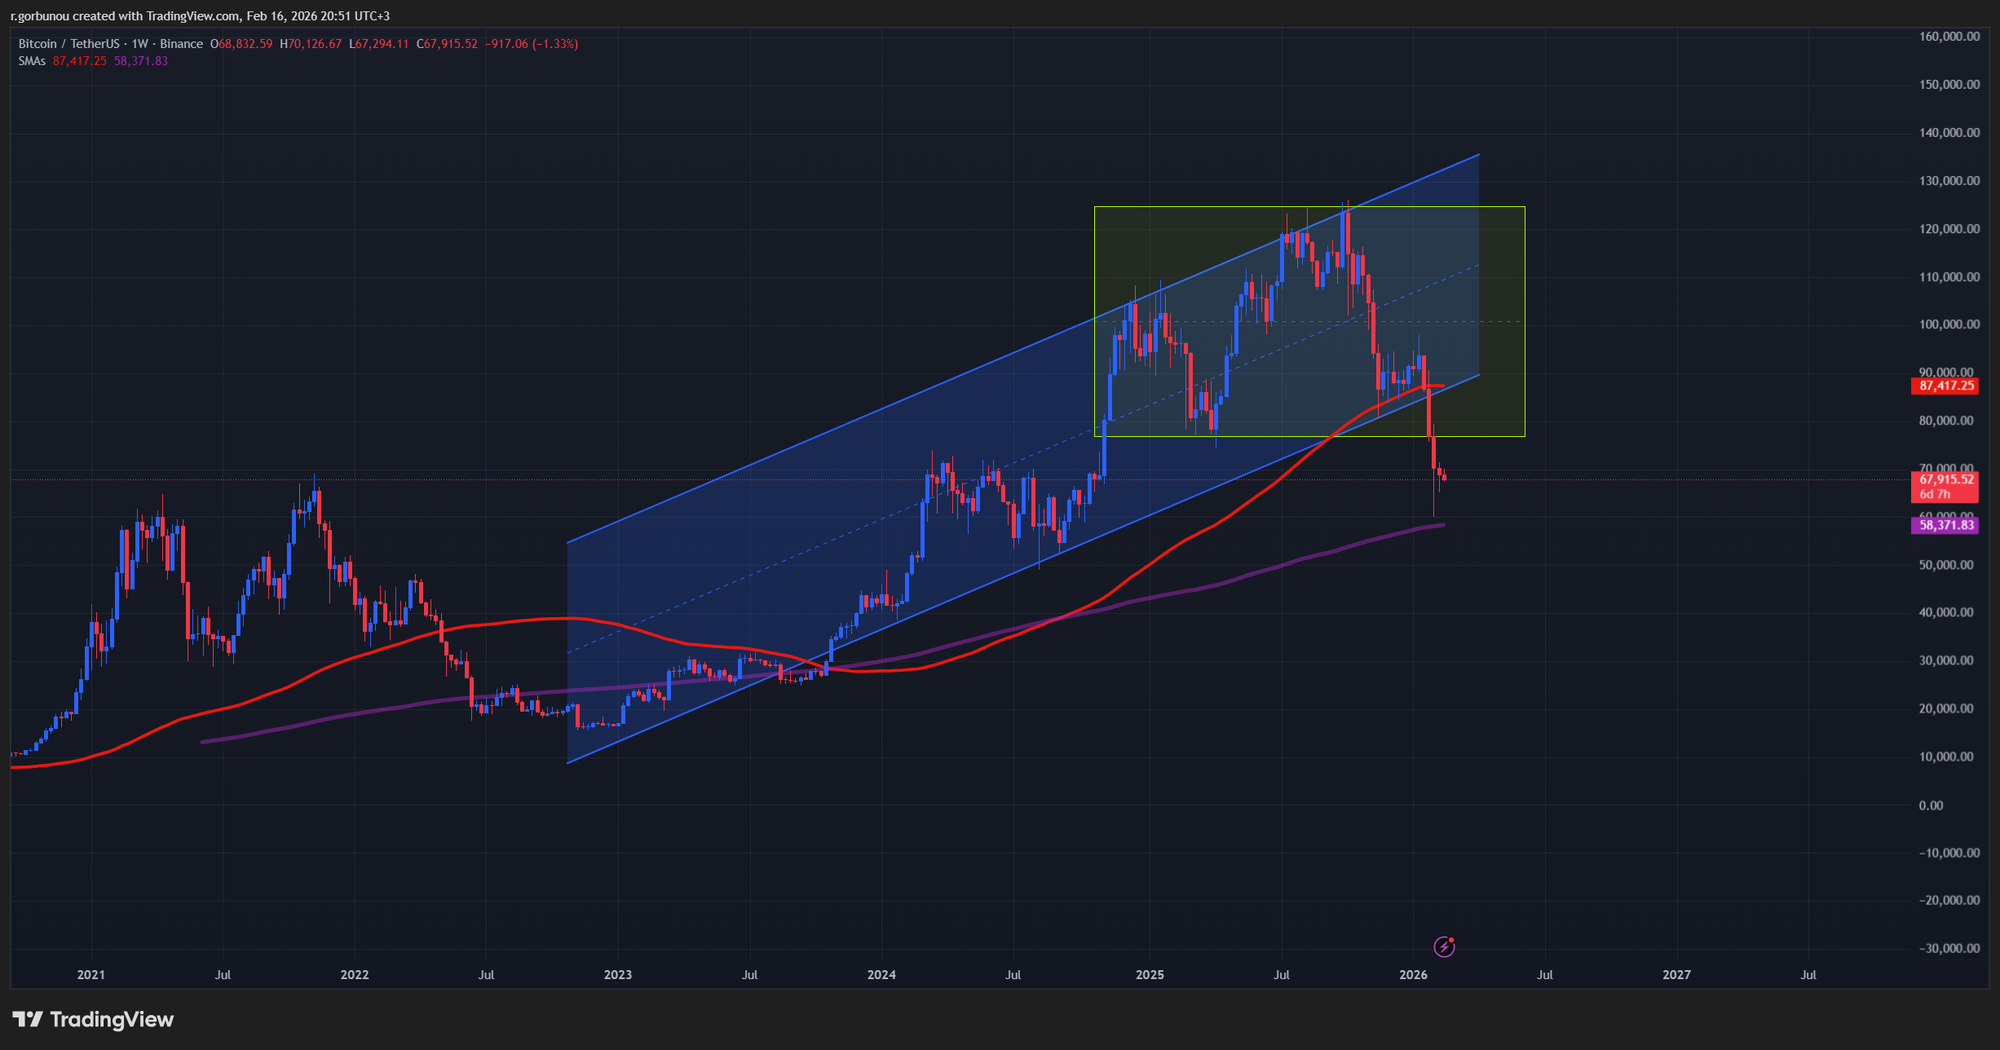
- Destruction of Trend Integrity: The 200-week SMA represents the long-term cost basis of the market over the last four years. A breach of this level invalidates the entire post-2022 bullish narrative. Once this "psychological floor" is lost, the transition from a "bullish expansion" to a "structural bear" is technically sealed, as no major support remains above the extrapolated targets in the $20k range.
- The "Dead Zone" Accumulation Phase: Historically, once Bitcoin falls to or below its 200-week SMA, it does not bounce back immediately. It enters a prolonged "repair phase" or "Dead Zone." This is a multi-year period of sideways accumulation where trapped participants (from the channel break and EMA retest) are slowly shaken out, and institutional trust must be rebuilt from scratch.
- Liquidity Misalignment: As identified in Section 2.2, the macro liquidity "expansion engine" is currently stuck in a 110-day lag. Targeting the $58,000 SMA confirms that the "Price Bottom" is occurring well before the "Next Expansion" is ready. This creates a structural gap where the price stays suppressed by high real rates for an extended period (1-2 years), effectively transforming a tactical correction into a multi-year regime shift.
Conclusion: Confirming the Structural Shift
The vertical breakdown of the 2023-2026 ascending channel and the immediate retest of the 200-week EMA signify a fundamental shift in market regime. Reaching the $58,371 200-week SMA would act as the final confirmation signal that the "buy the dip" era is over. The resulting loss of trend integrity and the misalignment with global liquidity timing ensure that this transition is not a temporary shock, but the start of a multi-year bear cycle characterized by deep distribution and a prolonged wait for the next liquidity impulse.
2.6 BTC Halving Cycles: The 21-Month Rule & Time-to-Bottom Analysis
Analyzing Bitcoin through the lens of its four-year halving cycles provides a rigorous temporal framework for identifying cycle maturity. Current data indicates that the market has entered the definitive terminal phase of the post-halving expansion.
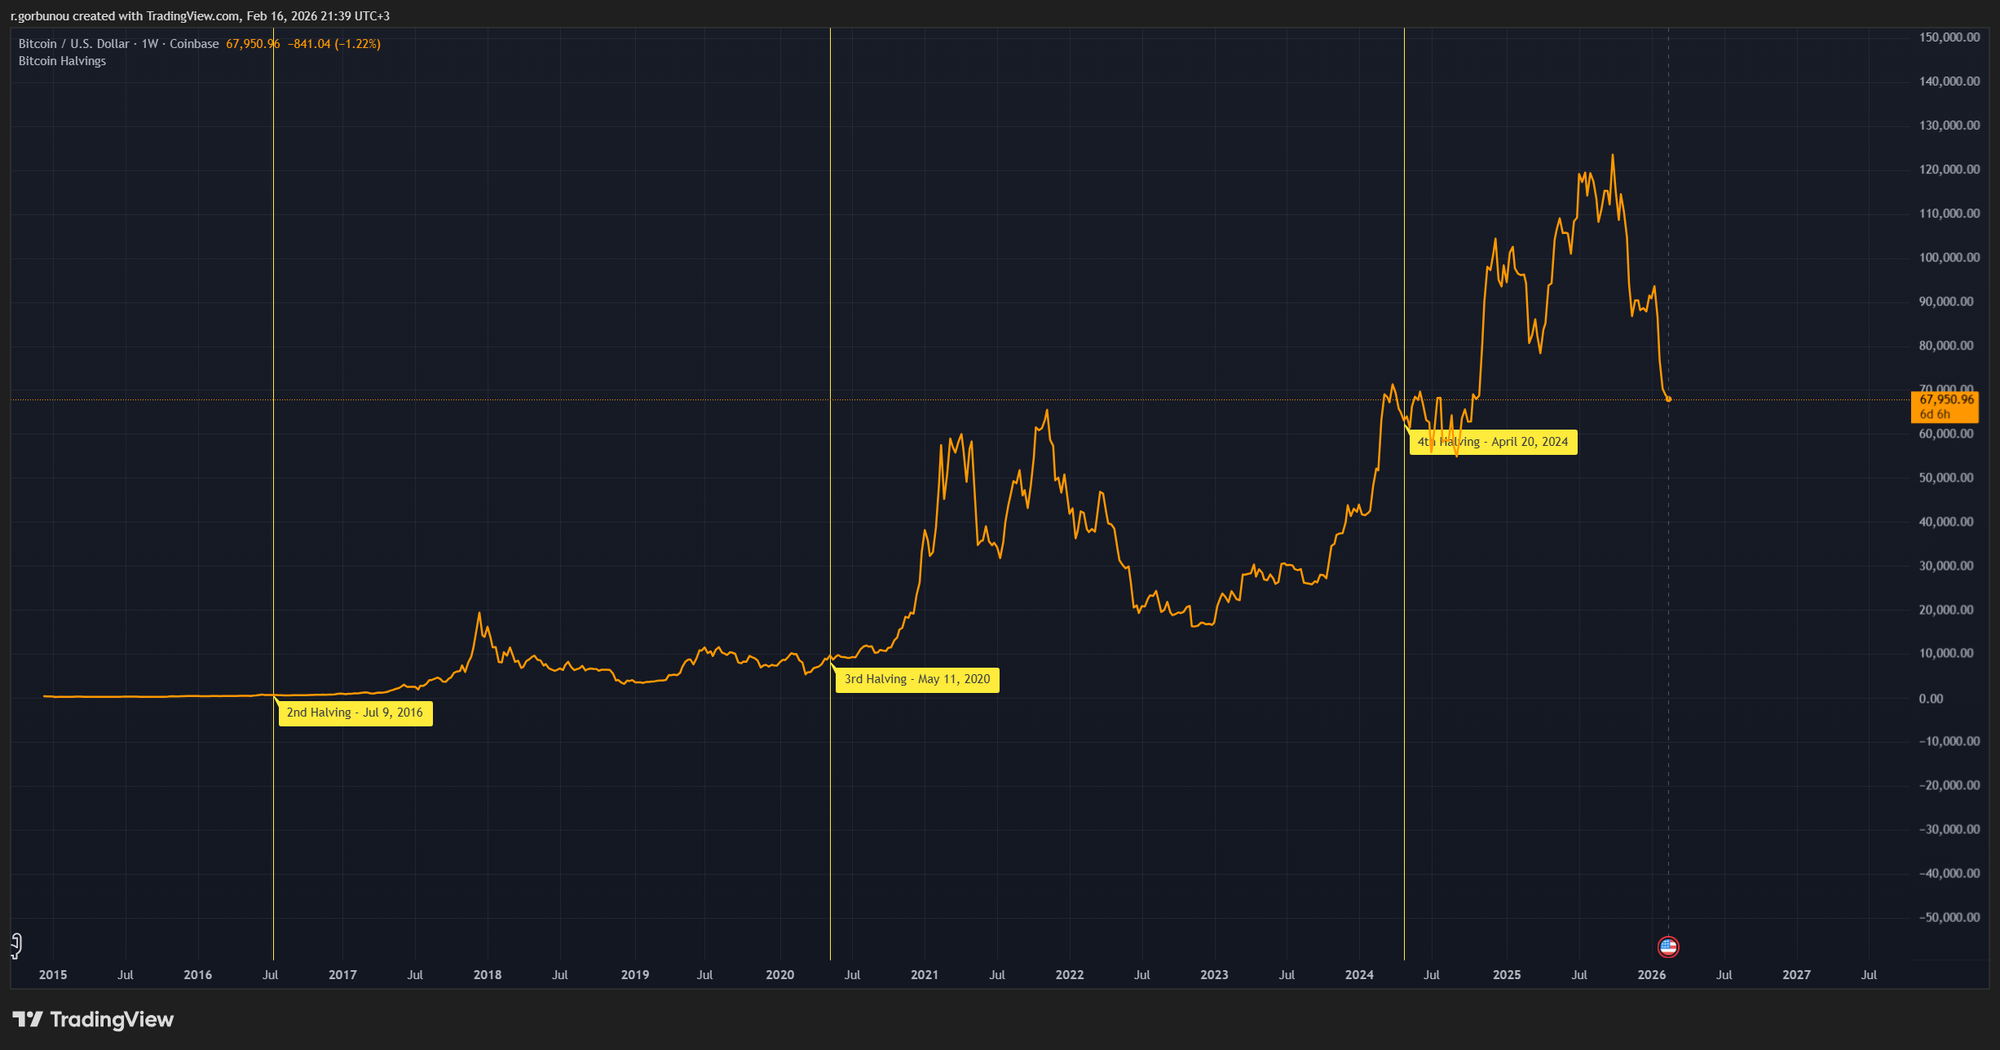
The "21-Month Rule": Exhaustion of Momentum
Historically, Bitcoin reaches a point of speculative exhaustion between months 20 and 22 post-halving. By this window, the initial supply shock has been fully priced in, and the market typically enters a secular bear market or a major multi-month correction.
- Cycle Comparison: The 4th Halving occurred on April 19, 2024. As of February 16, 2026, the market is currently in Month 22. The price pattern observed—specifically the vertical breach of the ascending channel and the creation of a local lower low—is a classic signal that the post-halving momentum has officially exhausted, perfectly aligning with historical temporal exhaustion markers.
Historical Halving to Macro Peak Durations
Halving Event |
Halving Date |
Peak Date |
Months to Peak |
|---|---|---|---|
1st Halving |
Nov 28, 2012 |
Nov 29, 2013 |
12 Months |
2nd Halving |
July 9, 2016 |
Dec 17, 2017 |
17 Months |
3rd Halving |
May 11, 2020 |
Nov 10, 2021 |
18 Months |
4th Halving |
April 20, 2024 |
Oct 2025 (Peak) |
18 Months |
AVERAGE |
— |
— |
~16.25 Months |
The 2025 peak occurred 18 months post-halving, mirroring the duration of the 2021 cycle and confirming that Bitcoin's cycle length remains remarkably consistent even as institutional adoption grows.
Historical Halving to Market Bottom Timeline
The path from halving to the eventual cycle bottom follows a distinct long-term trend. By mapping current progress against previous "days to bottom" durations, we can define the probable floor window for 2026.
| Halving Event | Halving Date | Next Cycle Bottom | Days from Halving to Bottom |
|---|---|---|---|
1st Halving |
Nov 28, 2012 |
Jan 2015 |
~777 Days |
2nd Halving |
July 9, 2016 |
Dec 2018 |
889 Days |
3rd Halving |
May 11, 2020 |
Nov 2022 |
924 Days |
4th Halving (Proj 1) |
April 19, 2024 |
June 5, 2026 |
777 Days (Shortest) |
4th Halving (Proj 2) |
April 19, 2024 |
Aug 30, 2026 |
863 Days (Mean) |
4th Halving (Proj 3) |
April 19, 2024 |
Oct 30, 2026 |
924 Days (Max) |